Figure 3.

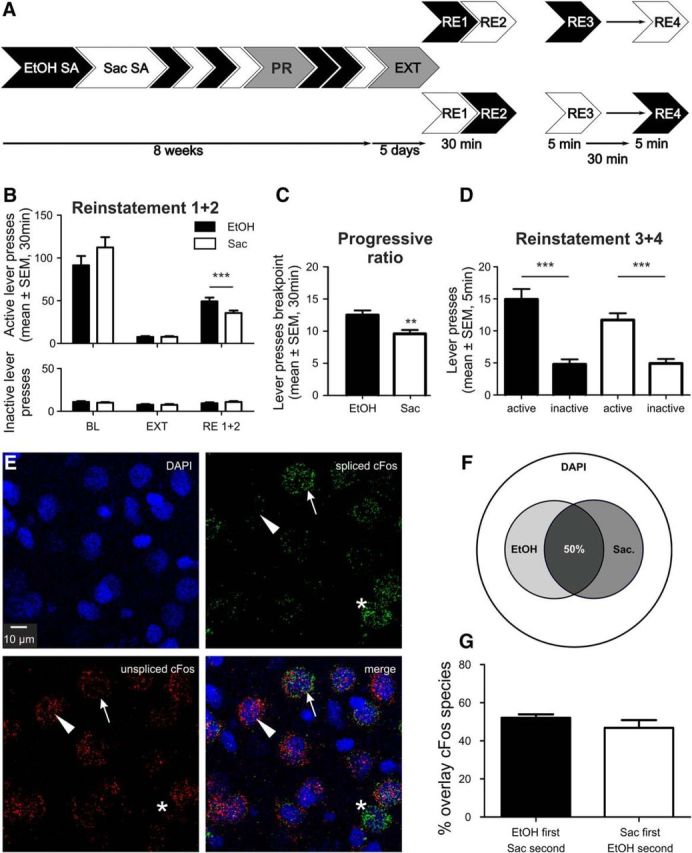
Largely overlapping IL ensembles involved in ethanol and saccharin seeking. A, Experimental timeline for ethanol (EtOH) and saccharin (Sac) self-administration (SA), extinction (EXT), and counterbalanced cued reinstatement sessions (RE1 + 2) and a final session (RE3 + 4, n = 14) for activation of ethanol and saccharin ensembles in the same animal. B, Active and inactive lever presses (mean ± SEM) for ethanol and saccharin self-administration baseline (BL), EXT and RE1 + 2 (n = 24). C, Breakpoint analysis (PR) for the ethanol and saccharin rewards (n = 24). D, Lever presses (mean ± SEM) for EtOH and saccharin in RE3 + 4 (n = 14). E, Representative images of double cFos ISH for DAPI counterstaining, spliced and unspliced cFos. Arrows indicate a double-positive cell. Triangles represent a single-positive cell for unspliced cFos. Asterisks indicate single-positive cell for spliced cFos only. F, Venn diagram indicating the size of saccharin and ethanol ensembles in relation to total cell number (DAPI). G, Quantification of overlay between both ensembles (mean ± SEM). **p < 0.01, ***p < 0.001. For detailed statistics, see Results and Table 3.
