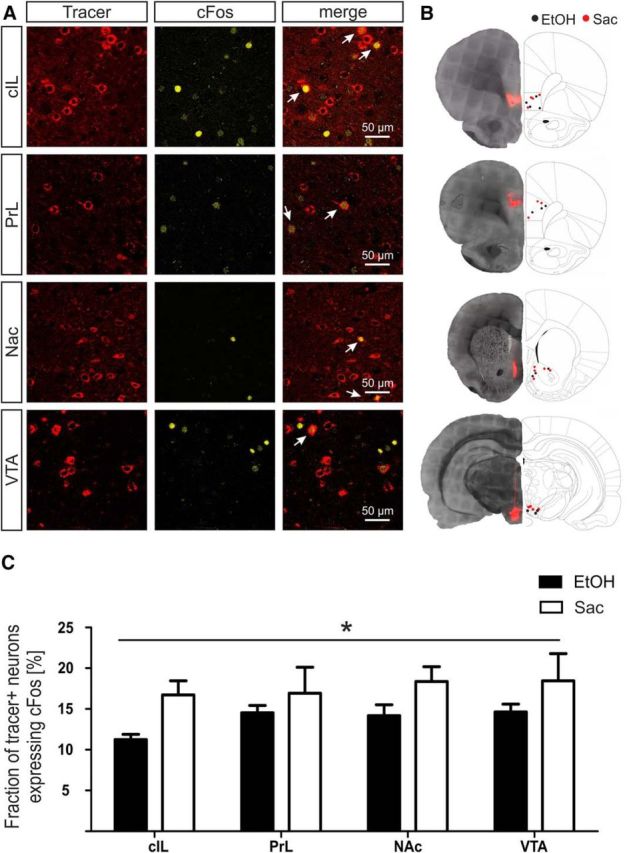
Figure 5.

Differences in activated IL projections during ethanol and saccharin seeking behavior. A, Representative images of retrograde tracer signals and cFos immunolabeling in the IL. Top to bottom, Colocalization of cFos with retrograde tracer signals from contralateral IL (cIL), ipsilateral prelimbic cortex (PrL), nucleus accumbens (NAc) and ventral tegmental area (VTA). Arrows indicate colocalization. B, Black dots represent injection placements for ethanol (EtOH). Red circles represent injection placements for the saccharin (Sac) group. Injection sites were verified in contralateral IL and PrL 3.0 mm anterior to bregma, Nac 1.6 mm anterior to bregma, and VTA −5.3 posterior to bregma. Adapted from Paxinos and Watson (1998). C, Quantification of the fraction of cFos+ tracer neurons (mean ± SEM) of activated IL projections during ethanol and saccharin seeking. *p < 0.05.
