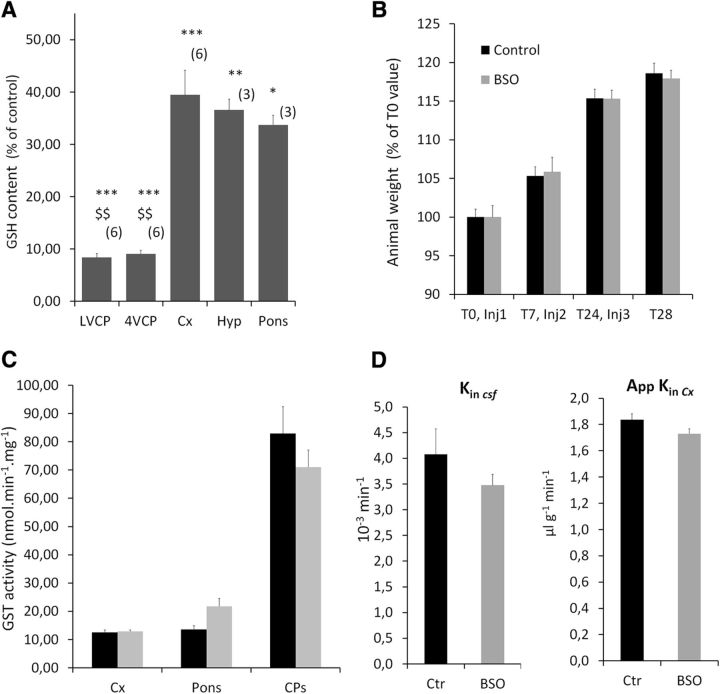
Figure 3.
Characterization of the choroid plexus glutathione-depleted animal model. A, Levels of GSH in tissue from animals treated with BSO. Choroidal tissue is depleted from GSH by >90%, while 40% of GSH is still present in brain tissue after BSO treatment. Data are calculated as micromoles per milligram of tissue and are expressed as the percentage of values measured in DMSO-treated control animals, and the mean ± SEM (n). *p < 0.05, **p < 0.01, ***p < 0.001, different from control animals. $$p < 0.01, different from Cx or Pons, two-tailed Student's t test for unequal variance. LVCP and 4VCP, choroid plexuses from the lateral and fourth ventricle, respectively; Cx, Cerebral cortex; Hyp, hypothalamus. B, Animal weight from the time of treatment initiation (T0) to the time of killing, 4 h following the third injection (T28). Animals were treated by three injections of BSO or vehicle (control). A typical experiment is shown. Data are expressed as the percentage of weight at T0, mean ± SEM, n = 6. No difference in weight gain was observed between the two groups of animals. C, Enzymatic GST activity toward CDNB in homogenates from tissue sampled from control (black bars) and GSH-depleted (gray bars) animals. BSO treatment did not induce any significant change in GST-specific activity. Data are expressed as the mean ± SEM, n = 3. D, Blood–CSF permeability constant (Kin csf) and apparent blood–cerebral cortex permeability constant (AppKin Cx) for [14C]-sucrose in control (black bars) and BSO-treated (gray bars) animals. No difference in permeability was observed between the two groups of animals, indicating that the integrity of the blood–brain and blood–CSF barriers is preserved following BSO administration. Data are expressed as the mean ± SEM, n = 5.

