Figure 5.
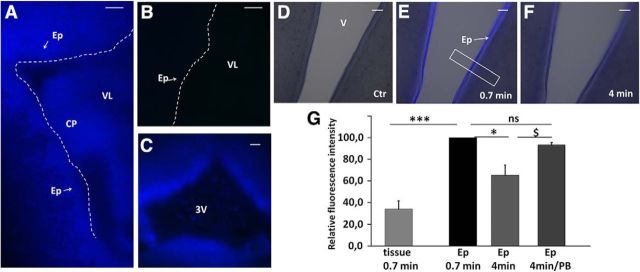
Conjugation to glutathione in the ependyma. A–C, Intracerebroventricular injection of MCB induced a rapid and strong fluorescence signal in the ependyma, reflecting GS-MCB production in these cells. In the lateral ventricle close to the site of injection, the signal was seen in both the ependyma and choroid plexus (A). The contralateral ventricle was used as a negative control (B). The ependyma of the third ventricle was also labeled within 1 min following MCB injection (C). D–F, Freshly prepared ependyma-containing brain slices also generated GSH conjugates upon addition of MCB to the medium. D represents the initial image before MCB addition. The fluorescent metabolite GS-MCB was rapidly produced at a higher level in the ependyma than in the adjacent brain tissue (E). The concentration of GS-MCB in ependyma decreased over time (F). G, Relative quantification of fluorescence intensity recorded in the ependyma and adjacent brain tissue in the presence or absence of 2.5 mm probenecid. Data are expressed as percentage values of the signal measured in ependyma in the same slice 0.7 min after MCB addition; data are the mean ± SEM (n = 6). The box in E shows a typical area from which a fluorescent profile was obtained and analyzed (see Materials and Methods). *p < 0.05 and ***p < 0.001, statistically different, paired t test for unequal variance. $p < 0.05, statistically different, one-tailed t test for unequal variance. CP, choroid plexus; Ep, Ependymal layer; VL, lateral ventricle; 3V, third ventricle; PB, probenecid. Scale bars: A–C, 100 μm; D–F, 50 μm.

