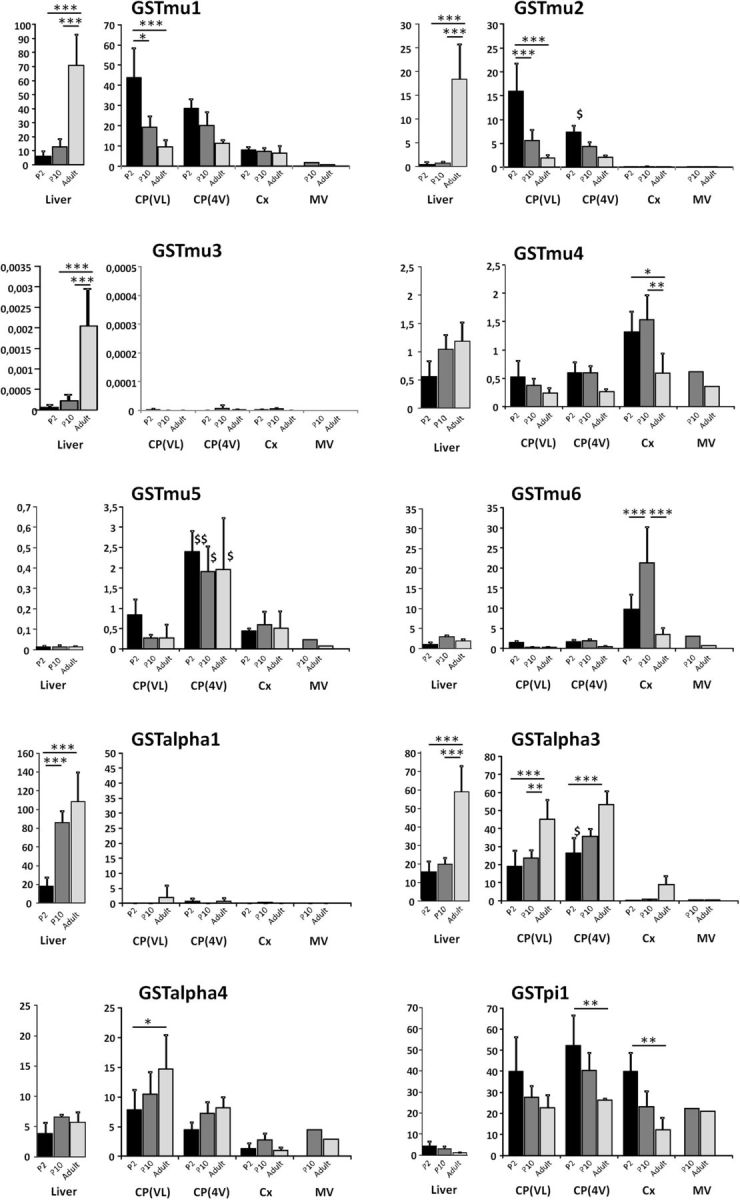
Figure 6.

Developmental profiles of glutathione S-transferase transcript levels in choroid plexuses, cerebral cortex, cerebral microvessels, and liver in the rat. RT-qPCR was performed in tissues sampled at three developmental stages. For each isoenzyme gene, the right panel shows data obtained for cerebral structures, and the left panel shows liver data. The results, expressed relative to the bacterial AraB gene added as an external standard, are shown as the mean ± SD, n = 4, except for the microvessels, for which values represent the mean of two preparations. Gene expression levels did not differ by >44% between the two age-matched microvessel preparations or were both low (<0.3). The results are expressed as arbitrary units and are all normalized to the expression level found for GSTμ1 in one sample of liver obtained from an adult animal and set arbitrarily at 100 (see Materials and Methods; for details on calculations, see Kratzer et al., 2013). *p < 0.05, **p < 0.01, ***p < 0.001, statistical significance of differences in expression levels between developmental stages, analyzed by one-way ANOVA followed by a Tukey's multiple-comparison test. $p < 0.05 and $$p < 0.01, statistical significance of differences in expression levels between age-matched choroid plexuses of the lateral and fourth ventricle, two-tailed paired Student's t test. For clarity, other relevant statistical significances, assessed by one-way ANOVA followed by a Tukey's multiple-comparison test are stated in the Results section. CP(LV) and CP(4V), choroid plexuses from the lateral and fourth ventricles, respectively; Cx, Cerebral cortex; MV, cerebral microvessels.
