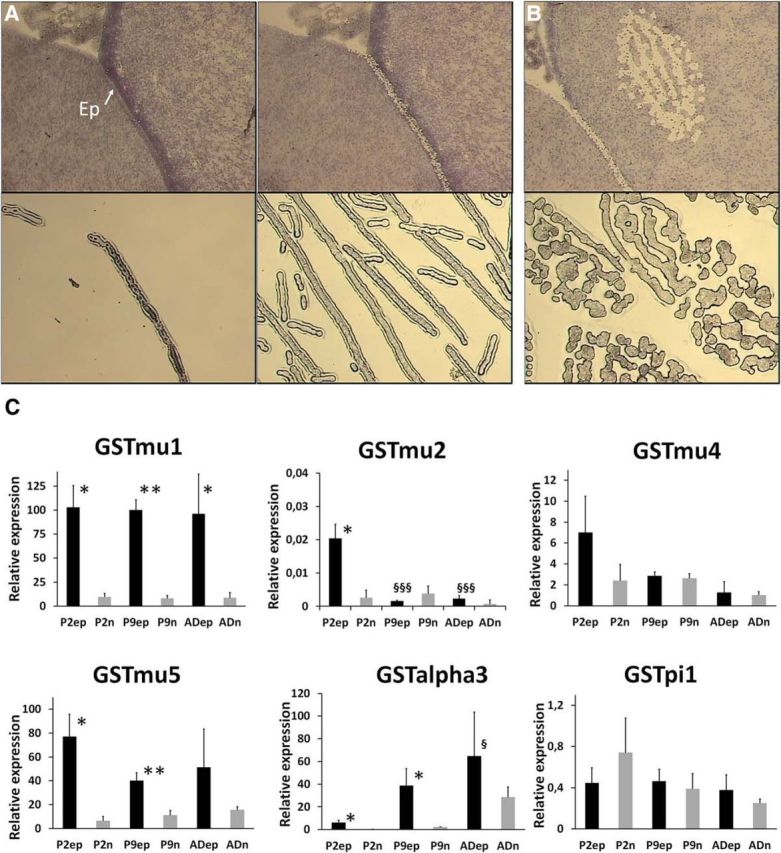
Figure 8.

Glutathione S-transferase transcript levels in ependymal cells and adjacent neuropil during postnatal development. A, Top, An example of a tissue section before and after laser microdissection of the ependyma. The lower sections show the ependyma microdissected from the tissue and a preparation of pooled microdissected ependyma. B, The two panels show the area of adjacent neuropil analyzed and the microdissected tissue obtained. C, Transcript levels of selected GST isoenzymes at three developmental stages. The results, expressed relative to the bacterial AraB gene added as an external standard, are shown as the mean ± SD, n = 3. The results are expressed as arbitrary units and are all normalized to the expression level found for GSTμ1 in one sample of ependyma obtained from P2 animals, and set arbitrarily at 100. GSTα1, GSTα4, and GSTμ6 were not detected in microdissected samples. *p < 0.05 and **p < 0.01, statistical significance of the difference in expression levels between the ependyma and the adjacent neuropil, one-tailed paired Student's t test. §p < 0.05 and §§§p < 0.001, statistical significance of the differences in expression levels in P9 and adult animals compared with P2 animals in a given tissue, one-way ANOVA followed by a Tukey's multiple-comparison test. Ep, Ependyma; P2ep and P2n, ependyma and adjacent neuropil from P2 rat; P9ep and P9n, ependyma and adjacent neuropil from P9 rat; ADep and ADn, ependyma and adjacent neuropil from adult rat.
