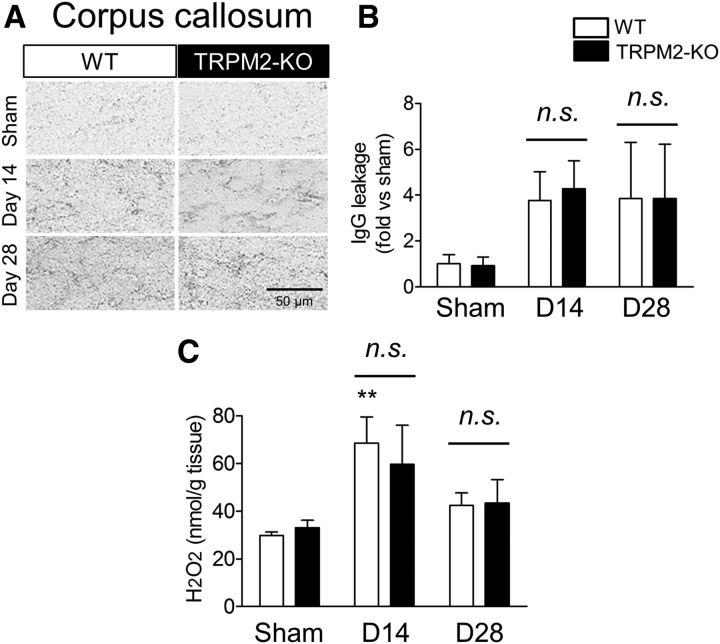
Figure 4.
No differences were observed in BBB permeability and ROS production in the corpus callosum between WT and TRPM2-KO mice at days 14 and 28 after BCAS. A, B, Representative images (A) and relative leakage (B) evaluated by IgG staining. C, The level of measured H2O2 content. **p < 0.01 vs WT sham. Values are mean ± SEM. B, n = 4–8; C, n = 5–6. n.s., Not significant.

