Figure 7.
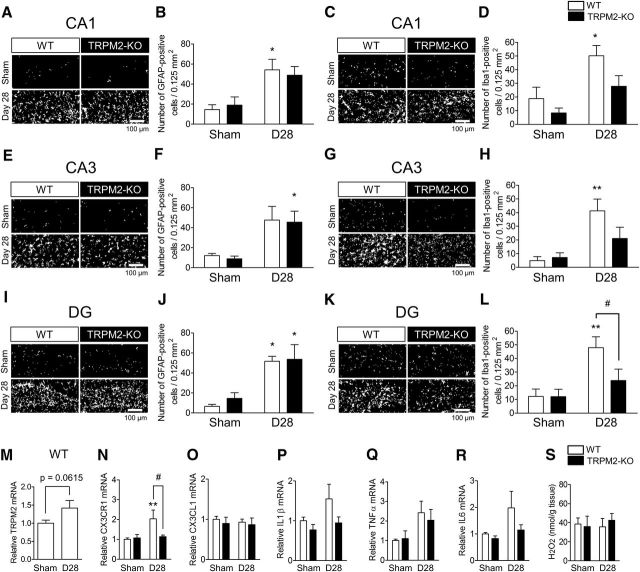
The numbers of GFAP- and Iba1-positive cells were increased but there was a slight change of cytokines in the hippocampus of WT mice at 28 d after BCAS. A, B, E, F, I, J, Representative images (A, E, I) and the number (B, F, J) of GFAP-positive cells in CA1 (A, B), CA3 (E, F), and DG (I, J). C, D, G, H, K, L, Representative images (C, G, K) and the number (D, H, L) of Iba1-positive cells in CA1 (C, D), CA3 (G, H), and DG (K, L). *p < 0.05 and **p < 0.01 vs WT sham; #p < 0.05 vs WT BCAS. M–R, The mRNA expression level of TRPM2 (M), CX3CR1 (N), CX3CL1 (O), IL1β (P), TNFα (Q), and IL6 (R) by real-time PCR. **p < 0.01 vs WT sham; #p < 0.05 vs WT BCAS. S, The level of measured H2O2 content. Values are mean ± SEM. B, D, F, H, J, L, n = 4–6; M–R, n = 5–13; S, n = 5–6.

