Figure 4.
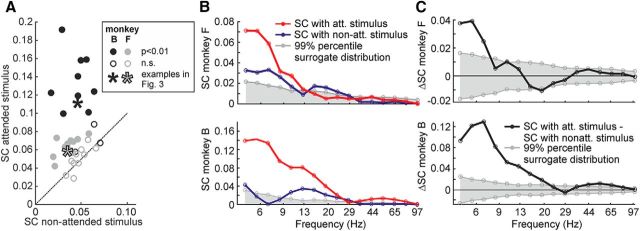
Attention-dependent signal gating across recording sites and its frequency dependence. A, Attention-dependent modulation of SC. Each circle or star represents a single recording site. Filled circles show recordings sites with a significant (p < 0.01) attentional effect calculated over the frequency range from 5 Hz up to 11 Hz, whereas open circles show no significant effect. Stars correspond to the examples depicted in Figure 3. Black and gray symbols depict recordings sites of Monkeys B and F, respectively. B, These plots show the frequency-dependent profiles of SC after pooling V4 sites with a significant gating effect (A, filled circles and stars) for both monkeys separately. The greatest differences between the SC with the attended stimulus (red lines) and the non-attended stimulus (blue lines) occur for the lowest frequencies. SC values above the black lines are significantly different from chance. C, Difference between the attentional conditions in B, directly plotted.

