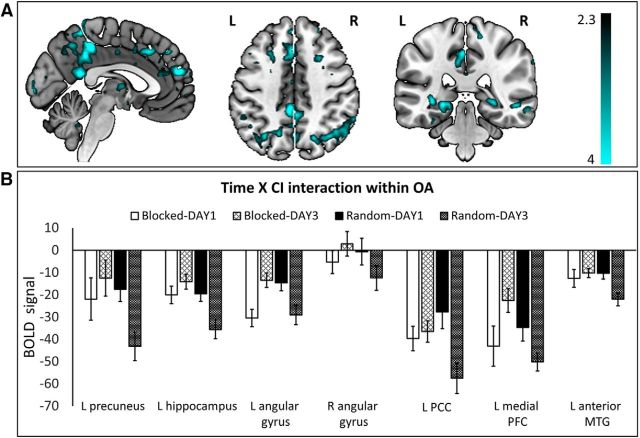
Figure 7.
DMN regions showing a significant Time × CI interaction effect (Model2) in OA adults. A, Activation maps of the Time × CI interaction in OA were overlaid on a mni152 template using MRIcroGL. The color map depicts Z values. B, BOLD signal (mean ± SE) extracted from voxels associated with DMN showing a significant Time × CI interaction effect. Clusterwise threshold Z > 2.3; p < 0.05.

