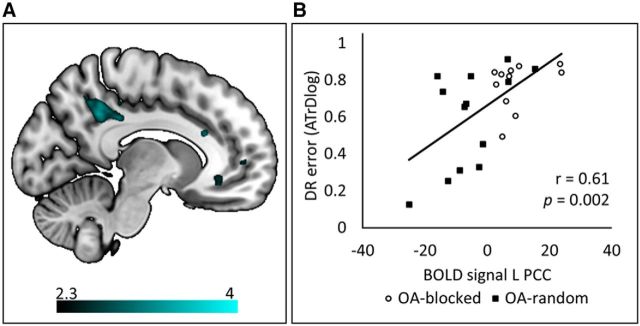
Figure 8.
Activation map showing a significant Age × CI interaction effect (Model3) in the left PCC during DR (A) and Pearson's correlation between BOLD signal and DR error (B). A, Activation map of the Age × CI interaction during DR was overlaid on a mni152 template using MRIcroGL with a color map indicating Z values in activity maps. B, Scatter plot correlation between BOLD signal extracted from the peak voxel (left PCC) and DR performance error. Older adults who followed blocked practice showed higher PCC activation compared with those who followed random practice, and this was positively correlated with error score during DR, indicating that greater PCC activation was associated with higher error (poorer performance) on DR. Activity in this region did not differ between the blocked and random groups within young adults. The Age × CI interaction effect revealed significant activity in the PCC, using a clusterwise threshold Z > 2.3 and p < 0.05.

