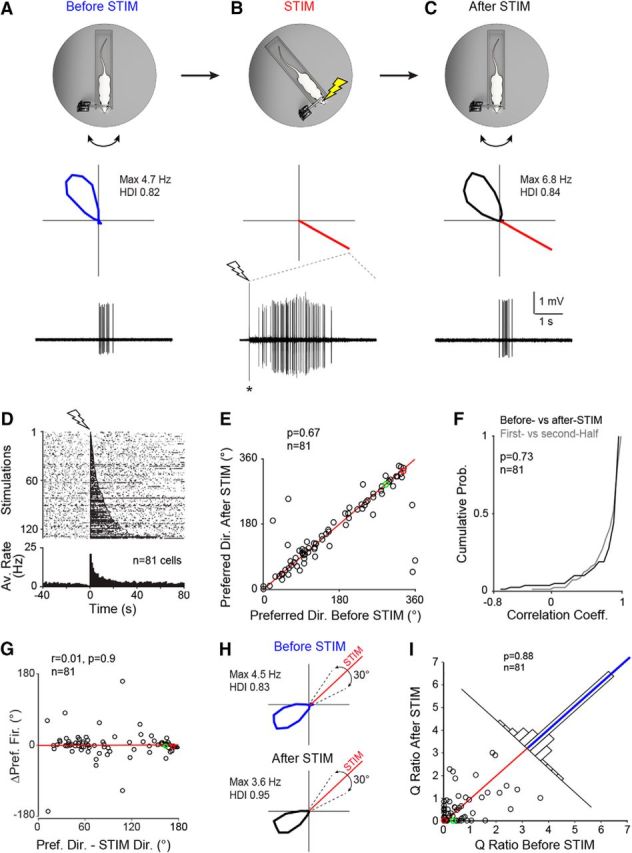
Figure 2.

Single-cell stimulation in a cue-rich familiar environment. A, Top, Schematic representation of the Open recording configuration consisting of a head-fixed rat on a rotating platform in the presence of a rich set of proximal and distal cues (see also Preston-Ferrer et al., 2016). Middle, Polar plot showing firing rate as a function of HD for a representative PreS HD neuron recorded during passive rotation. Peak firing rate and HD index are indicated. Bottom, High-pass-filtered spike trace for the HD cell recording shown above. B, Same as A but for juxtacellular stimulation (STIM) at ∼150° away from the preferred direction. The polar plot (middle) indicates the stimulus direction (red line). Bottom, High-pass-filtered voltage trace showing a spike train evoked by a brief juxtacellular current injection (see Materials and Methods). The onset of current injection is indicated by the lightning bolt symbol. The asterisk indicates stimulus artifact, truncated for display purposes. C, Same as in A but after the juxtacellular stimulation shown in B. Note that HD tuning remained largely unchanged compared with before stimulation (A). D, Raster plot (top) and average firing rate histogram (bottom) for all spike trains evoked in HD neurons under passive rotation (n = 130 stimulations in 81 neurons). Recordings are aligned by the first spike of the evoked stimulus train (lightning bolt symbol). For display purposes, all stimulations are shown in the raster plot; however, multiple stimulations within individual neurons were averaged before being entered into the firing rate histogram so that each cell contributed one data point. E, Scatterplot showing preferred directions computed before and after the stimulation. Red line indicates the identity line. The red and green circles correspond to the representative examples shown in A–C and H, respectively. The number of cells and the p-value (Wilcoxon signed-rank test) are indicated. F, Cumulative probability plot showing the correlation coefficients for HD tuning curves computed before and after stimulation (black) and for the two halves of the recordings before stimulation (gray). The number of cells and the p-value are indicated. G, Scatter plot showing Δ preferred directions (i.e., preferred direction after stimulation-preferred direction before stimulation) as a function of the stimulus distance from the preferred direction (i.e., preferred direction-STIM direction). The red and green circles correspond to the representative examples shown in A–C and H, respectively. The linear regression line (red), the correlation coefficient (r), the number of cells, and the p-value are indicated. H, Polar plots showing the activity of another HD cell before and after the stimulation (rotated by 45° for display purposes). Dotted lines indicate the 30° interval centered on the stimulus direction (red line) used for computing the Q ratios (see I and text for more details). Peak firing rates and HD indices are indicated. I, Scatterplot showing the Q ratios (i.e., the ratios between the average firing rate within and outside a 30° interval centered on the stimulus direction) computed for all cells before and after the stimulation. The red and green circles correspond to the representative examples shown in A–C and H, respectively. Red line indicates the identity line and the blue line on the top histogram represents the median. The number of cells and the p-value (Wilcoxon signed-rank test) are indicated. More details about the stimulation procedures can be found in Figures 2-1 and 2-2.
