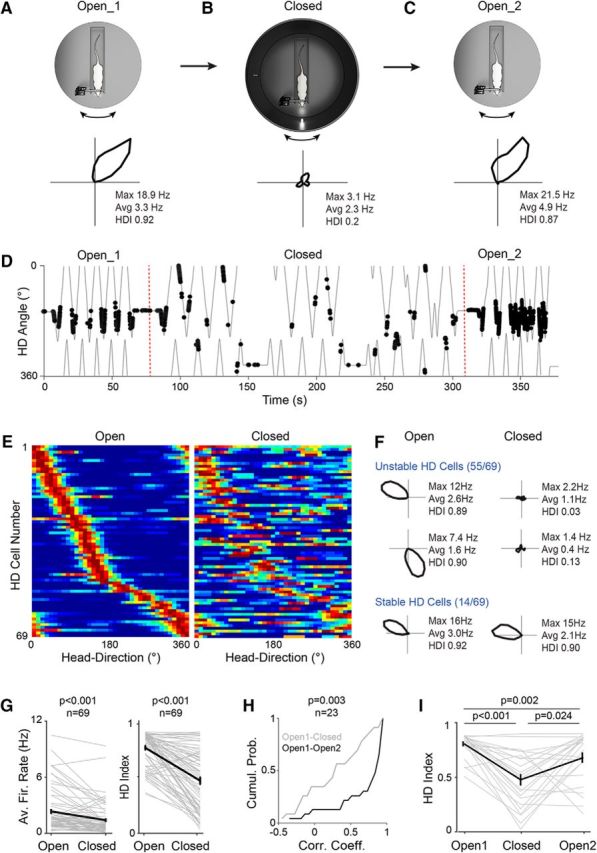
Figure 3.

Unstable HD activity in the presence of a single proximal visual cue. A–C, Top, Schematic representation of the recording protocol in which the activity of the neurons (n = 69) was sequentially monitored in the Open (A, Open_1) and Closed (B) configuration. For a subset of neurons (n = 23), the activity was monitored in the Open configuration again (C, Open_2). Note the presence of a cylinder surrounding the animal and a single proximal visual cue (LED) in the Closed configuration. Bottom, Polar plots showing firing rate as a function of HD for a representative HD cell recorded sequentially in the Open_1, Closed, and Open_2 configurations. Peak and average firing rates and HD indices are indicated. D, Spike trajectory plot showing the angular HD as a function of time for the same cell shown in A–C. Spikes (black dots) are indicated. The dotted red line indicates the transition across the different configurations. Note the sharp HD tuning of the cell in both Open Configurations (Open_1 and Open_2) compared with the Closed configuration (Closed). E, Color-coded distribution of preferred direction for all HD cells (n = 69) recorded sequentially in the Open (left) and Closed (right) configurations. Each row represents the firing rate of a single neuron (normalized relative to its peak firing rate; red) ordered by the location of their peak firing rates relative to the rat's HD in the Open Configuration. F, Polar plots showing the activity of representative “stable” and “unstable” HD cells sequentially recorded in the Open and the Closed configuration. Peak and average firing rates and HD indices are indicated. G, Average firing rates and HD indices computed in the Open and Closed configuration (n = 69 neurons, gray lines). Black lines indicate the averages. Error bars indicate SEM. p-values are indicated (Wilcoxon signed-rank test). H, Cumulative probability plot showing the correlation coefficients of HD tuning curves for the Open_1 versus Closed configuration (gray) and for the Open_1 versus Open_2 configuration (black). The number of cells and the p-value (Wilcoxon signed-rank test) are indicated. I, HD indices computed in the Open_1, Closed, and Open_2 configurations (n = 23 neurons, gray lines). Black line indicates the average. Error bars indicate SEM. p-values are indicated (Wilcoxon signed-rank test; Bonferroni correction for multiple comparisons).
