Figure 5.
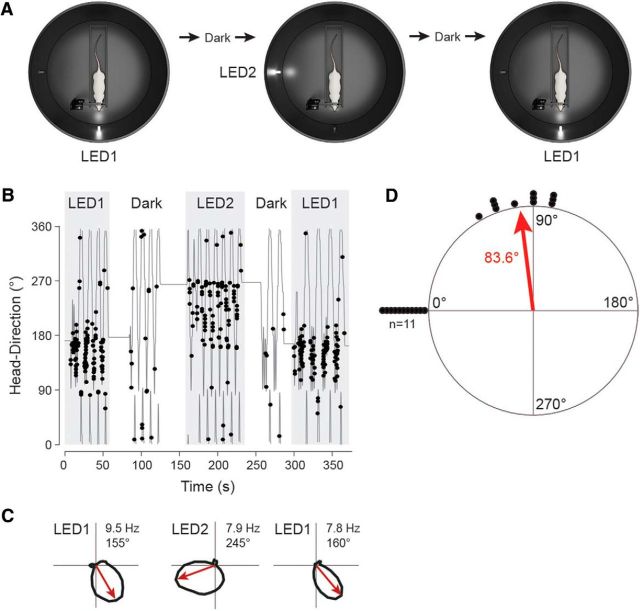
HD cell realignment after cue rotations. A, Schematic drawing showing the recording protocol for 90° cue rotations (LED1→LED2 and LED2→LED1). Cue rotations were interleaved with brief dark phases (see Materials and Methods for details). B, Angular HD as a function of time for a representative HD cell recorded following the protocol shown in A. Spikes (black dots) are indicated. Note the consistent shift of the neuron's preferred direction upon cue rotations (LED1→LED2 and LED2→LED1). C, Polar plots showing firing rates as a function of HD computed for LED1 (left), LED2 (middle), and the return to LED1 (right) for the same cell shown in B. Preferred directions (red arrows) and peak firing rates are indicated. D, Scatter diagrams showing the amount of angular shift of preferred directions between LED1 and LED2 configurations. Each dot represents a single cell (n = 11). The preferred directions shown by all cells in the LED1 configuration are aligned at 0°; therefore, those shown during the LED2 configuration are represented clockwise (because LED2 was placed 90° clockwise with reference to LED1). The average angle is indicated by the red arrow.

