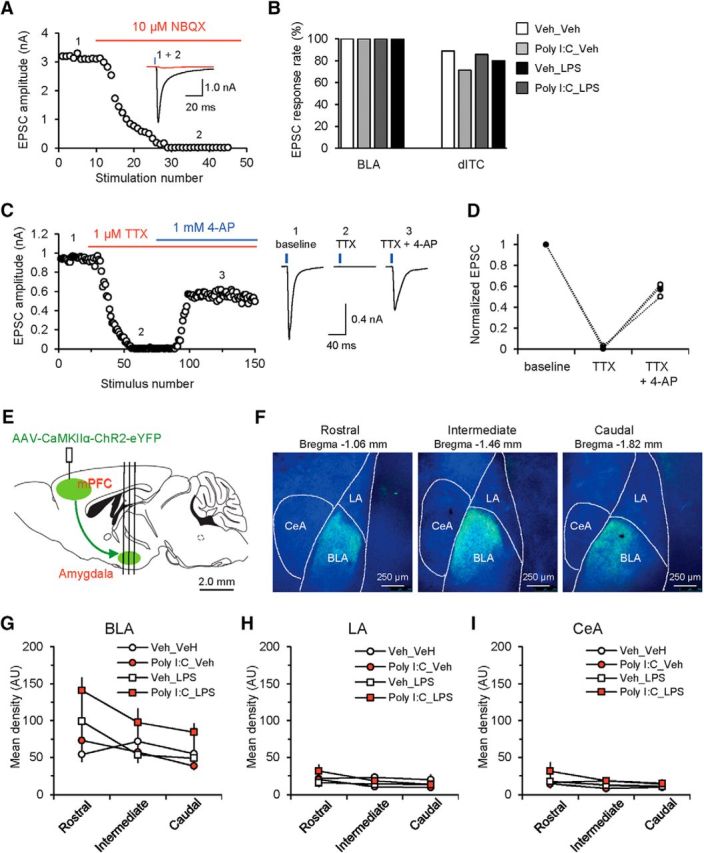
Figure 3.

mPFC–AMG synaptic connectivity and innervation patterns of the AMG by ChR2-expressing mPFC projection fibers. A, Light-evoked EPSCs recorded in BLA PNs at −80 mV were blocked by the AMPA/kainate receptor antagonist NBQX (10 μm). B, Fractions of neurons in the BLA and the dorsal cluster of intercalated cells in the AMG (dITC) in which EPSCs could be observed in response to photostimulation of mPFC afferents in slices from all groups. In these recordings, the light power density was 10.5 mW/mm2. BLA: n = 38 neurons from 38 recorded cells in Veh_Veh group, n = 30 neurons from 30 recorded cells in Poly I:C_Veh group, n = 36 neurons from 36 recorded cells in Veh_LPS group, n = 36 neurons from 36 recorded cells in Poly I:C_LPS group; dITC: n = 8 neurons from 9 recorded cells in Veh_Veh group, n = 5 neurons from 7 recorded cells in Poly I:C_Veh group, n = 6 neurons from 7 recorded cells in Veh_LPS group, n = 8 neurons from 10 recorded cells in Poly I:C_LPS group. C, Rescue of optogenetically induced and TTX-blocked EPSCs at mPFC(PL)-BLA projections by 4-AP. Left, Graph showing the time course of changes in the EPSC amplitude under control conditions (1), after application of TTX (2), and after the subsequent addition of 4-AP (3). Right, EPSCs (average of 10 traces) recorded in a BLA neuron at −80 mV under different experimental conditions. EPSCs evoked by photostimulation (with 5-ms-long pulses) of ChR2-expressing mPFC fibers were blocked by TTX (1 μm). An addition of 4-AP (1 mm) in the presence of TTX partially rescued the EPSC (as in Cho et al., 2013; n = 3 neurons), confirming monosynaptic nature of activated mPFC–BLA projections. D, Summary plot of the EPSC amplitudes in TTX only and TTX + 4-AP. Peak amplitudes of EPSCs were normalized to the baseline EPSC recorded under control conditions. Open circles represent individual experiments, whereas closed circles show average values (n = 3 neurons). E, Experimental design for the analysis of mPFC–AMG connectivity. Vertical lines indicate location of coronal sections through the AMG shown in F. F, Microscopic images showing innervation of the AMG by ChR2-eYFP-expressing mPFC fibers (green) in coronal brain sections (300 μm in thickness) along the rostral–caudal axis. Blue fluorescence indicates DAPI counterstain. CeM, Medial division of the central nucleus; dITC, dorsal cluster of intercalated cells in the AMG. G–I, Mean densities of ChR2-eYFP fluorescence due to the innervation by mPFC projections in different sections along the rostral-caudal axes in BLA (G), LA (H), and central nucleus of the AMG (CeA) (I) in slices from all experimental groups (Veh_Veh group: n = 16 slides from 6 mice; Poly I:C_Veh: n = 14 slides from 4 mice; Veh_LPS: n = 18 slides from 6 mice; Poly I:C_LPS: n = 17 slides from 6 mice).
