Figure 4.

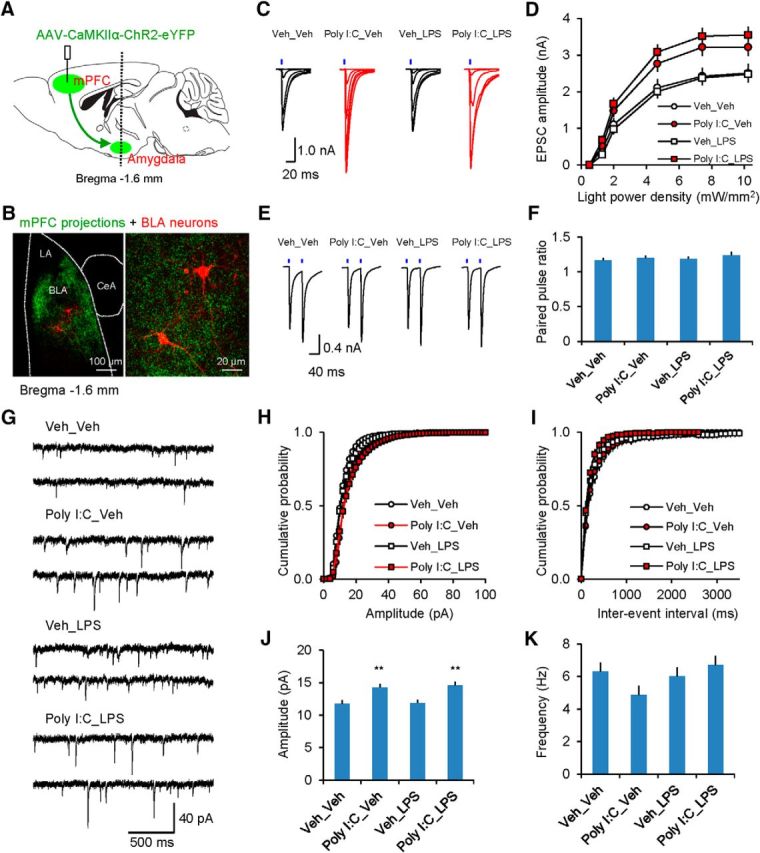
MIA but not PIA results in increased synaptic strength in glutamatergic mPFC projections to the BLA. A, Experimental design for optogenetic analysis of mPFC–AMG projections. A vertical line indicates location of a coronal section through the AMG shown in B. B, Left, Confocal microscopic image showing ChR2-eYFP-expressing mPFC fibers in the AMG (green). Red fluorescent cells in the BLA are neurobiotin-filled neurons. Right, Higher-magnification image of the same section. C, EPSCs (average of five responses) recorded in PNs in mPFC–BLA projections in voltage-clamp mode at a holding potential −80 mV in slices from different experimental groups. EPSCs were evoked by photostimuli of increasing intensity. D, Input/output plots for peak amplitudes of EPSCs at the mPFC–BLA synapses in all experimental groups (Veh_Veh group: n = 39 neurons from 12 mice; Poly I:C_Veh: n = 28 neurons from 9 mice; Veh_LPS: n = 36 neurons from 9 mice; Poly I:C_LPS: n = 38 neurons from 12 mice). E, EPSCs in BLA PNs were evoked by paired photostimuli (50 ms interpulse interval) at the saturating photostimulation intensity (10.2 mW/mm2) in slices from all groups. F, There was no effect of the treatments on the paired-pulse ratio magnitude (Veh_Veh group: n = 25 neurons from 12 mice; Poly I:C_Veh: n = 24 neurons from 9 mice; Veh_LPS: n = 16 neurons from 9 mice; Poly I:C_LPS: n = 28 neurons from 12 mice). G, Examples of sEPSCs recorded in BLA neurons. H, I, Cumulative amplitude (H) and interevent interval (I) histograms of sEPSCs recorded in slices from all groups. J, K, Summary plots of the mean sEPSC amplitude (J) and the frequency (K) in slices from all groups (Veh_Veh group: n = 10 neurons from 5 mice; Poly I:C_Veh: n = 9 neurons from 6 mice; Veh_LPS: n = 8 neurons from 4 mice; Poly I:C_LPS: n = 9 neurons from 5 mice). **p < 0.01.
