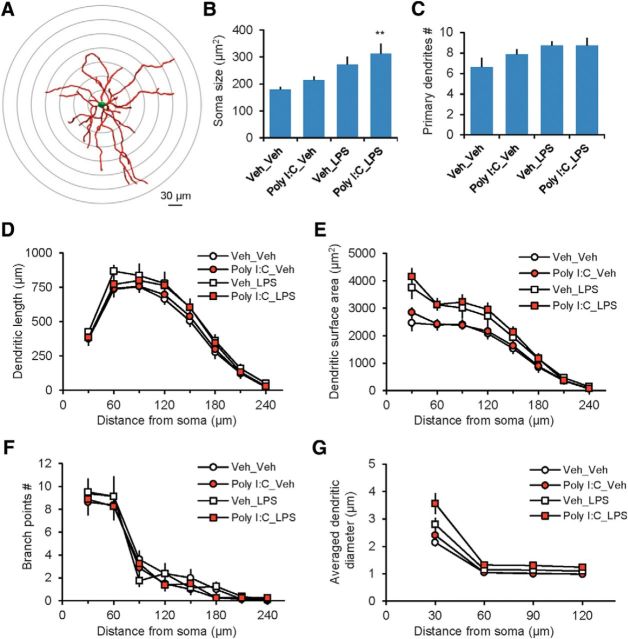
Figure 5.
Sholl analysis of dendritic morphology in the BLA after immune activation. A, Sholl dendritic analysis of reconstructed neurobiotin-filled BLA neurons was performed by placing a series of concentric circles spaced at 30 μm intervals and centered on the soma. B, Average soma size estimates in all experimental groups. There was a significant increase in the soma size in LPS-treated mice (see text for details). C, Averaged number of primary dendrites in all experimental groups. D, Summary plot of the dendritic length as a function of the radial distance from soma by 30 μm increments. There was a main effect of LPS on the dendritic length: three-way ANOVA (Poly I:C × LPS × distance from soma, Poly I:C, F(1,224) = 0.272, p = 0.603; LPS, F(1,224) = 10.499, p = 0.001; interaction, F(7,224) = 0.64, p = 1.0; post hoc Bonferonni's test: p = 0.004 for Veh_Veh versus Veh_LPS). E, Summary plot of the dendritic surface area as a function of the radial distance from soma. There was an increase in the dendritic surface area in Veh_LPS and Poly I:C_LPS groups versus Veh_Veh group: three-way ANOVA (Poly I:C × LPS × distance from soma, Poly I:C, F(1,224) = 1.681, p = 0.196; LPS, F(1,224) = 51.762, p < 0.001; interaction, F(1,224) = 0.086, p = 0.99; post hoc Bonferonni's test: p < 0.001 for both Veh_Veh versus Veh_LPS and Veh_Veh versus Poly I:C_LPS groups). F, Averaged number of branch points. There was no difference in branch point numbers between the groups: three-way ANOVA (Poly I:C × LPS × distance from soma, Poly I:C, F(1,224) = 2.27, p = 0.133; LPS, F(1,224) = 0.0396, p = 0.842; interaction, F(7,224) = 0.338, p = 0.936). G, Averaged dendritic diameter as a function of distance from soma. There was an increase in the averaged dendritic diameter in the Veh_LPS and Poly I:C_LPS groups versus Veh_Veh group: three-way ANOVA (Poly I:C × LPS × distance from soma, Poly I:C, F(1,112) = 7.5, p = 0.007; LPS, F(1,112) = 30.197, p < 0.001; interaction, F(3,112) = 0.376, p = 0.771; post hoc Bonferonni's simultaneous multiple comparisons: p = 0.032 for Veh_Veh versus Veh_LPS and p < 0.001 for Veh_Veh group versus Poly I:C_LPS group). Veh_Veh group: n = 8 neurons from 5 mice; Poly I:C_Veh: n = 8 neurons from 4 mice; Veh_LPS: n = 8 neurons from 7 mice; Poly I:C_LPS: n = 8 neurons from 6 mice). **p < 0.01.

