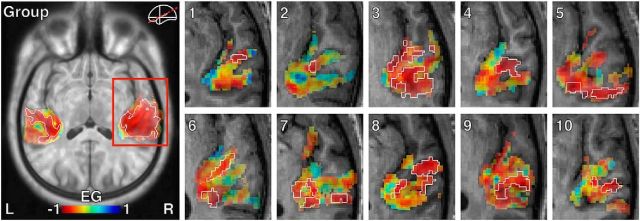
Figure 8.
Distribution of tuning curve EG across auditory cortex. Fixed-effects group average data (labeled Group) and individual data (labeled 1–10) are shown. Slices are oriented to run parallel to the lateral sulcus (see red line on inset schematic brain). Color code represents tuning curve EG of sound-responsive voxels. White outlines indicate voxels that showed a significant covariation with elevation in at least one of the three sessions.

