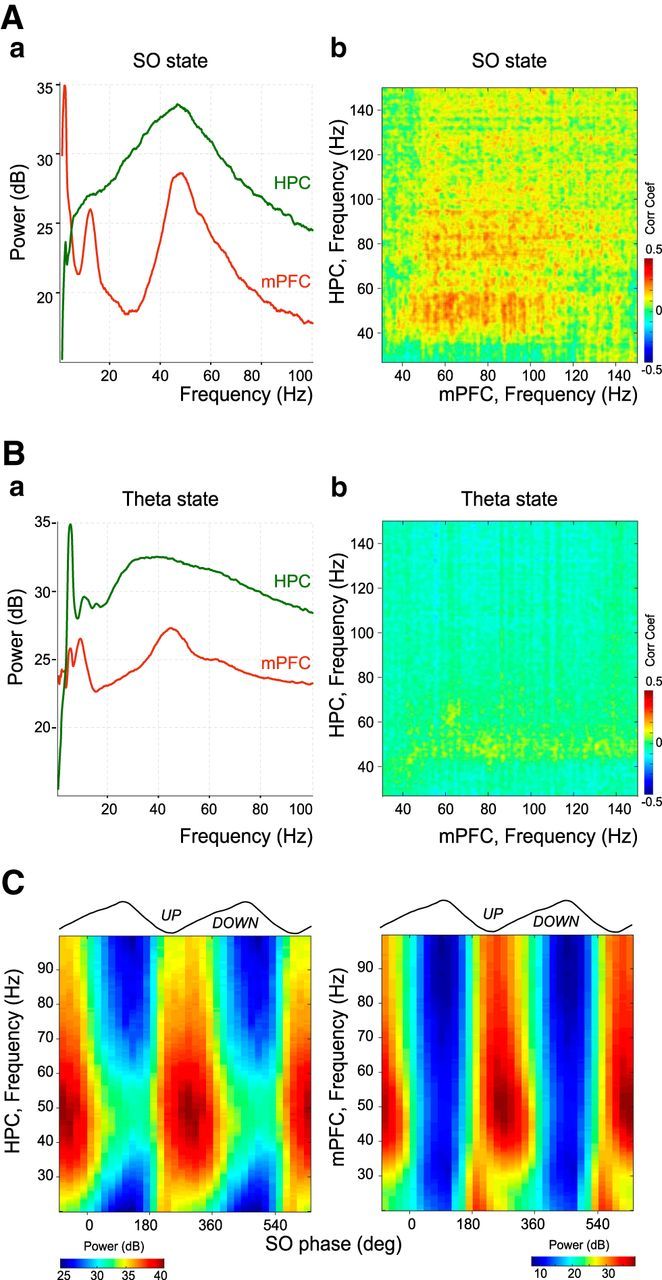
Figure 1.

HPC and mPFC interactions during theta and slow oscillation states. Aa, Whitened power spectra of mPFC and HPC LFPs during slow oscillation state (sO) from a template experiment. Ab, Comodugram describing the power relationship between HPC and mPFC LFPs shown in Aa in the gamma band. The correlation coefficient is color-coded. Ba, Whitened power spectra of mPFC and HPC LFPs during theta state from the same template experiment as in A. Bb, Comodugram between HPC and mPFC LFPs shown in Ba in the gamma band. Note the absence of correlation compared with the slow oscillation state (sO). C, Gamma amplitude-slow oscillation phase modulation plots of LFPs in HPC and mPFC from the same template experiment as in A. The gamma power dominated the trough and beginning of the ascending phase of mPFC slow oscillations.
