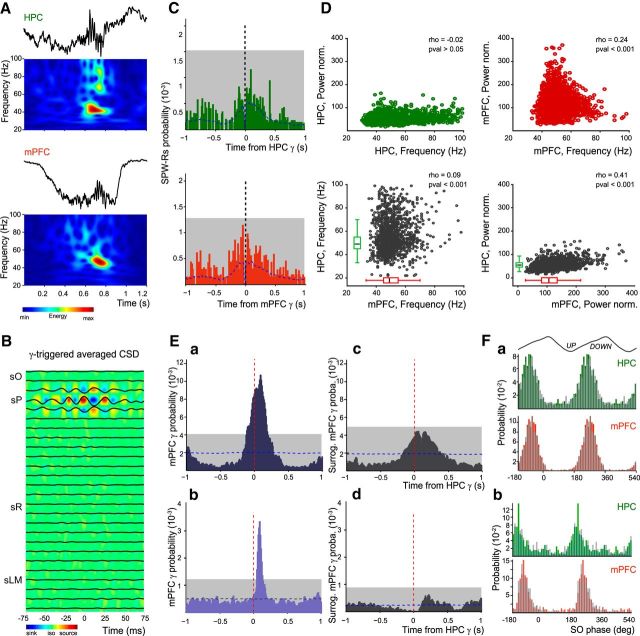
Figure 2.
Synchronous gamma bursts in HPC and mPFC during the slow oscillation state. A, Example of gamma bursts simultaneously recorded in HPC and mPFC and their corresponding normalized wavelet transforms. B, The gamma-triggered average CSD (computed from a template experiment) depicts an alternation of sinks and sources only around SP, suggesting a local generation of gamma bursts. sO, stratum oriens; sR, stratum radiatum; sLM, stratum lacunosum moleculare. C, Cross-correlation between HPC SPW-Rs and gamma bursts (grouped data, n = 8) detected in HPC (green bars) and in mPFC (red bars). Dashed vertical lines indicate zero-time lag; blue dashed lines indicate the mean of time-jittered gamma bursts. Note that no bin in both cross-correlograms is above the chance level (gray box; 0.01% significance level). D, Correlations between frequency and normalized power of HPC and mPFC gamma bursts (grouped data, n = 8). Note the low values of the correlation coefficients (rho; Pearson correlation). Ea, Cross-correlation between mPFC and HPC gamma bursts, using HPC gamma bursts as reference (dashed red line; grouped data, n = 8 animals), showing a significant correlation peak during slow oscillations in anesthesia. Dashed blue line: mean of time-jittered HPC gamma; gray box: 0.01% significance level (see Materials and Methods). Eb, Predicted cross-correlation between the surrogate mPFC gamma onsets (see Materials and Methods) with the regular HPC gamma onsets (grouped data, n = 8). Note the disappearance of the peak correlation. Ec, Cross-correlation between mPFC and HPC gamma bursts during natural slow-wave sleep (grouped data, n = 2 animals). Ed, Predicted cross-correlation between the surrogate mPFC gamma onsets and HPC ones during natural sleep. Note again the absence of correlation. F, Distribution histograms of gamma burst entrainment by slow oscillation phase for HPC and mPFC bursts during (Fa) anesthesia slow oscillations and (Fb) natural SWS (grouped data, n = 8). The plain bars (green, HPC; red, mPFC) represent the distribution of sync gamma events, and the overlaid gray bars correspond to the non-sync gamma bursts.

