Figure 3.
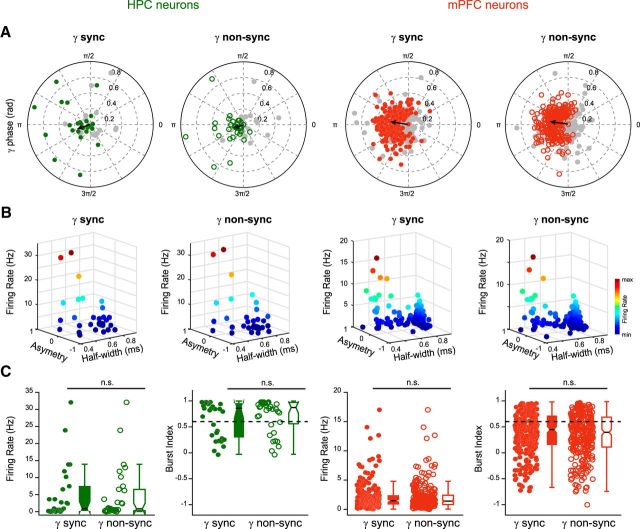
Gamma bursts entrain local neuronal populations. A, Polar plots of preferred phase and modulation depth of HPC (green) and mPFC (red) neurons referenced to sync and non-sync gamma bursts (grouped data, n = 8). The gray circles correspond to nonsignificantly entrained neurons (Rayleigh test, p ≥ 0.05). The black arrow indicates the mean phase and strength of modulation for the significantly entrained neurons only (gamma cycle peak = 0°). There was no significant difference in the mean phase and strength of the modulation between sync and non-sync groups (circular ANOVA, p ≥ 0.05, respectively). B, Relationship between spike half-width, asymmetry, and firing rate for the HPC and mPFC units significantly entrained by sync and non-sync gamma bursts as defined in A. Note the division into two groups, separating putative excitatory (right) from inhibitory (left) neurons (see Materials and Methods). C, Firing rates and burst indices of HPC and mPFC units significantly entrained by sync gamma bursts were no different from those entrained by non-sync gamma bursts (Wilcoxon test, p ≥ 0.05) indicating that both types of bursts did not segregate different neuronal populations.

