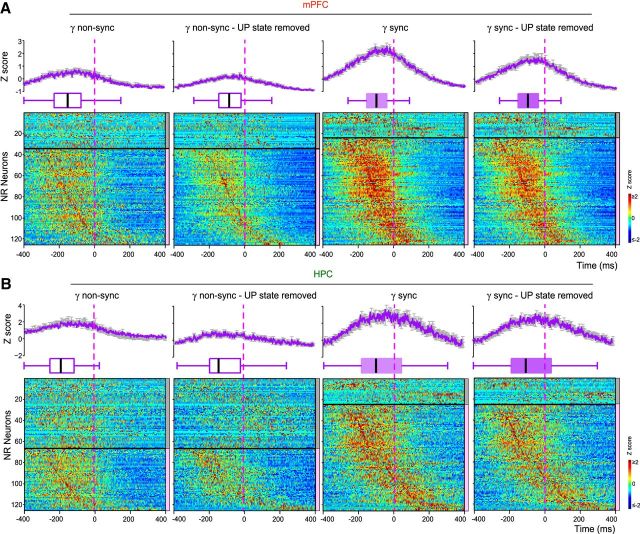
Figure 4.
Dynamics of NR neurons firing before gamma onset. A, Peri-gamma burst z-scored firing probability raster plots for all NR neurons, average (shaded error bars) firing probability curves and statistical boxes for all the NR neurons firing with respect to non-sync, sync, with or without the UP state contribution (UP state removed) mPFC gamma burst onset (dashed vertical line). The neurons are separated into two subgroups (horizontal black line) based on the significant increase of their firing with respect to mPFC gamma bursts, as indicated by the color scale (right): gray: p ≥ 0.05, pink: p < 0.05 (see Materials and Methods). The early increase of the firing in the significant group [−200 0] ms before sync gamma onset subsists after removing the UP state influence. Such behavior is less prominent for the non-sync events. B, Peri-gamma burst z-scored firing probability raster plots for all NR neurons, average firing probability curves and statistical boxes for all the NR neurons firing with respect to gamma bursts detected in HPC (dashed vertical line) constructed as in A.

