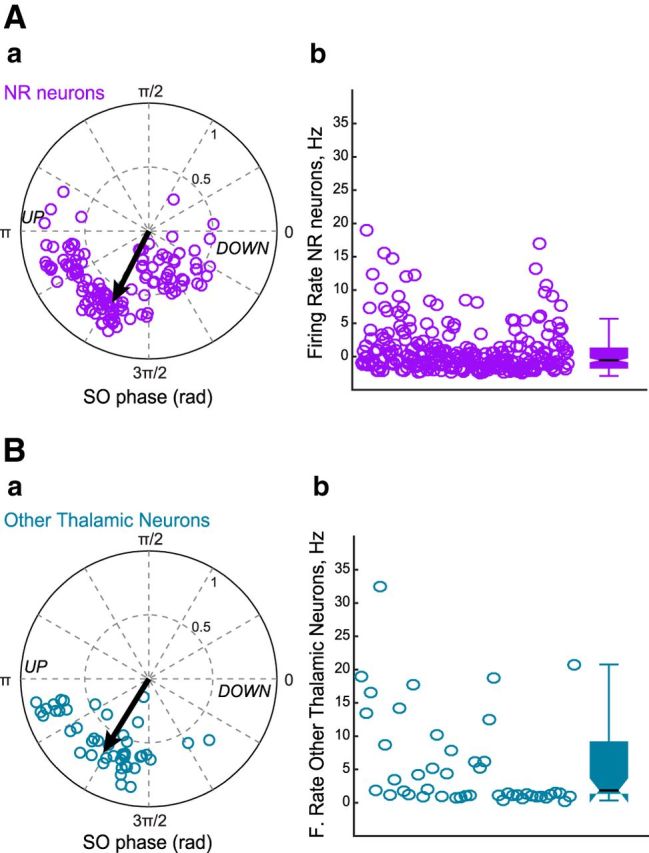
Figure 5.

Firing properties of thalamic neurons. Aa, Polar diagram of preferred phase and modulation strength of NR neurons referenced to slow oscillation cycle. The black arrow indicates the mean phase and strength of modulation (Rayleigh statistics). Ab, Mean firing rates calculated during slow oscillation episodes for NR neurons. The box plots represent the grouped data statistics for the 126 NR neurons recorded (n = 7 experiments). Ba, Polar representation of preferred phase and modulation depth for neurons belonging to thalamic nuclei neighboring NR (n = 46, 4 experiments) referenced to slow oscillation cycle. Bb, Mean firing rates calculated during slow oscillation episodes for other thalamic neurons (grouped data statistics).
