Figure 7.
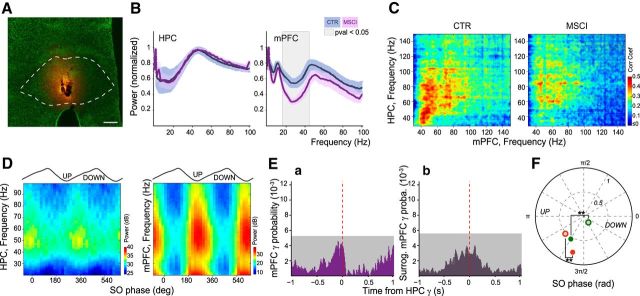
Chemical inactivation of NR abolishes the gamma synchrony. A, Visualization of the extent of BODIPY-Muscimol (MSCI: 0.7 nm in 0.3 μl; orange staining) injection in the NR (dashed line shows the NR contours) over green fluorescent Nissl-stained section of a template experiment. Scale bar, 250 μm. B, Normalized power spectra of mPFC and HPC LFPs in control (CTR; blue curves; n = 7) compared with MSCI (pink curves; n = 3) conditions. The ± SEM is presented as the lighter blue (control) and lighter pink (MSCI) bands. Gray zone: p < 0.05, t test. C, Mean comodugrams showing the power–power correlation between HPC and mPFC LFPs in control (left; n = 7) and MSCI (right; n = 3) conditions. Note the decrease in correlation in the [30 90] Hz band. D, Gamma amplitude-slow oscillation phase modulation plots of LFPs in HPC and mPFC during NR inactivation calculated from a template experiment. Note the drastic decrease in the modulation of HPC gamma and the phase shift compared with control (Fig. 1C). E, Cross-correlation between (Ea) mPFC gamma bursts and (Eb) the surrogate mPFC gamma onsets (see Materials and Methods) with respect to HPC gamma bursts (dashed red line) during NR inactivation. There was no significant peak in the correlation compared with the control condition (Fig. 2Ea) and the predicted cross-correlation did not show any correlation either. Gray box: 0.01% significance level; grouped data, n = 3. F, Polar plot of the mean preferred slow oscillation phase and modulation strength of HPC (green) and mPFC (red) gamma bursts in control (filled circles; n = 7) and MSCI experiments (open circles; n = 3). NR inactivation induced a significant phase shift (circular ANOVA, p < 0.001 for both comparisons) and a decrease of modulation strength (t test, p < 0.001 for both) of gamma bursts in both structures.

