Figure 8.
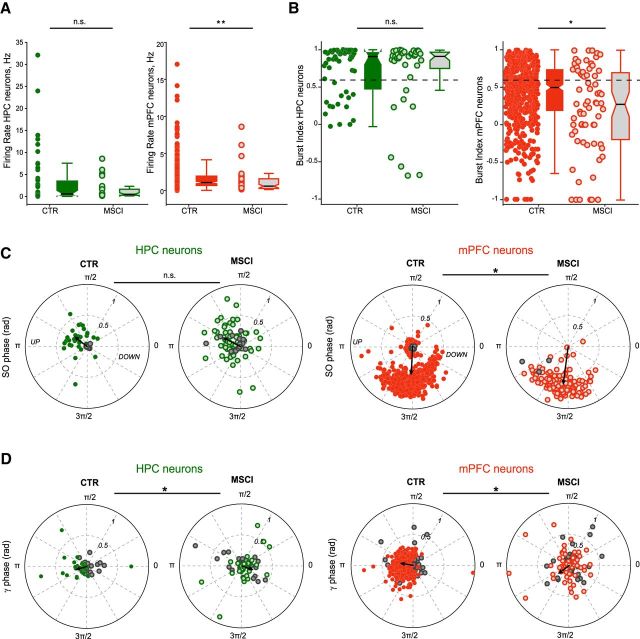
Firing properties of HPC and mPFC neurons during NR inactivation. A, Mean firing rates calculated during slow oscillation episodes in control (CTR) and during NR inactivation (MSCI) for HPC (CTR n = 55, MSCI n = 37) and mPFC neurons (CTR n = 496, MSCI n = 71). The box plots represent the grouped data statistics (CTR n = 7 experiments, MSCI n = 3). Only mPFC neurons showed a significant decrease of their firing rate (Mann–Whitney U test, **p < 0.001 for mPFC, p = 0.62 for HPC). B, Mean burst indices for the HPC and mPFC neurons shown in A. Note that, again, only mPFC neurons fired less in bursts (Mann–Whitney U test, *p = 0.006 for mPFC, p = 0.92 for HPC). C, Comparison of preferred phase and modulation depth of HPC and mPFC neurons referenced to the slow oscillation cycle in the control condition and during NR inactivation. The black arrow indicates the mean phase and strength of modulation. n.s., Not significant, *p < 0.05. D, Polar plots of preferred phase and modulation depth of HPC and mPFC neurons referenced to all the gamma bursts detected in HPC and mPFC, respectively, in the control condition and during NR inactivation. The nonsignificantly entrained neurons are depicted by the gray circles (Rayleigh test, p ≥ 0.05). The black arrow indicates the mean phase and strength of modulation for the significantly entrained neurons only. Both groups display a shift of the mean phase (circular ANOVA, *p < 0.001 for both) but not of the mean strength (two-sample t test, HPC p = 0.4947, mPFC p = 0.4038) of the modulation during NR inactivation compared with control.

