Figure 6.

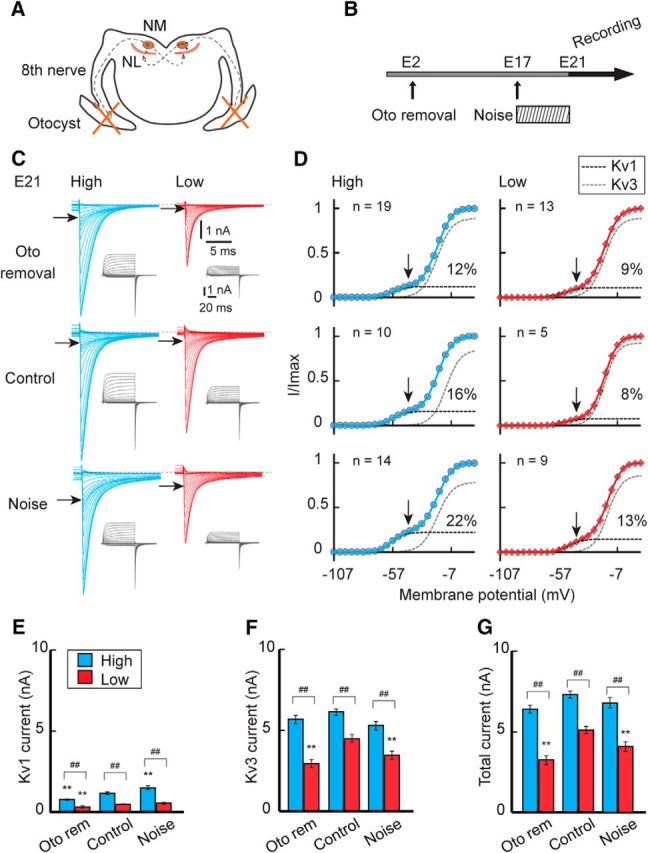
Effects of auditory inputs on the potassium current in embryos. A, B, Auditory inputs were attenuated or elevated in embryos by bilateral otocyst removal at E2 or by exposing eggs to noise between E17–E21. C, Potassium current in high-CF (left, blue) and low-CF (right, red) neurons at E21. Top, Otocyst removal. Middle, Control. Bottom, Noise exposure. D, Voltage dependence of activation curves. The curves were fitted by a double Boltzmann equation, showing low-voltage-activating (Kv1, black) and high-voltage-activating (Kv3, gray) components (see Materials and Methods). Percentage of the Kv1 component is specified at right in each panel. Vertical and horizontal arrows indicate −42 mV (C, D). E–G, Maximum amplitudes. Kv1 current (E), Kv3 current (F), and total current (G). The V1/2 and slope factor of the Kv1 and Kv3 currents did not change after the manipulations (p > 0.05, ANOVA). ##p < 0.01 between tonotopic regions. **p < 0.01 compared with control.
