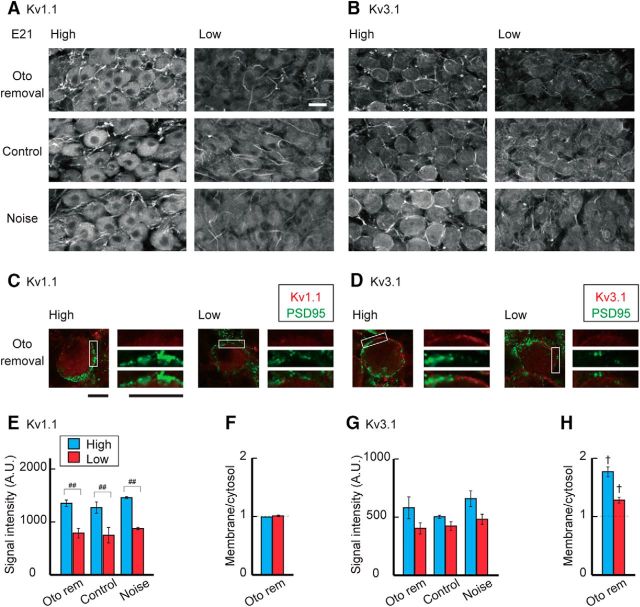
Figure 7.
Effects of auditory inputs on Kv1.1 and Kv3.1 expression in embryos. A, B, Immunosignals of Kv1.1 (A) and Kv3.1 (B) at E21 after attenuation or elevation of auditory inputs in embryos. Top, Otocyst removal. Middle, Control. Bottom, Noise exposure. C, D, Double immunostaining of Kv channels (red) and PSD95 (green) at E21 after otocyst removal. Right, Boxes are magnified. Kv1.1 (C) and Kv3.1 (D). Kv signals did not change much after otocyst removal. E, G, Signal intensity of Kv1.1 (E) and Kv3.1 (G) measured at cytosolic regions in the soma. F, H, Ratio of membranous and cytosolic signal intensities of Kv1.1 (F) and Kv3.1 (H) at E21 after otocyst removal. Measurements were made from 3 animals in each group. Scale bars: A, B, 20 μm; C, D, 10 μm. ##p < 0.01 between tonotopic regions. †p < 0.05 between membranous and cytosolic signals.

