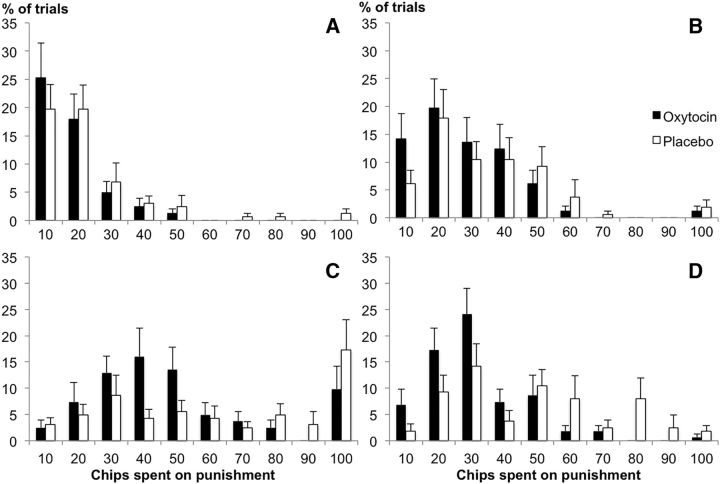
Figure 4.
Frequency of punishment in third-party punishment game. y-axis, Percentage of trials; x-axis, number of chips spent per punishment. A, Taker takes 25 chips; (B) Taker takes 50 chips; (C) Taker takes 75 chips; and (D) Taker takes 100 chips. Error bars indicate SEM. The more chips the Taker takes, the stronger the effect of oxytocin on the administration of smaller punishments. n = 54.

