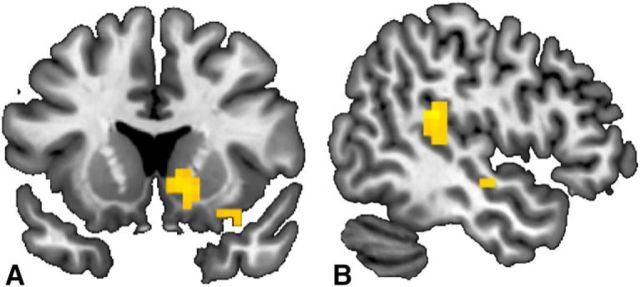
Figure 7.
Brain contrast maps displayed at p < 0.001 uncorrected. A, Punishment versus compensation: trials in which participants invested in second- and third-party punishment contrasted with trials in which participants invested in compensation; y = 14 (MNI). n = 42. B, Not punishing in response to unfair treatment: trials in which the Taker took chips and participants chose to not punish versus trials in which the Taker took chips and participants punished; x = −49 (MNI). n = 20.

