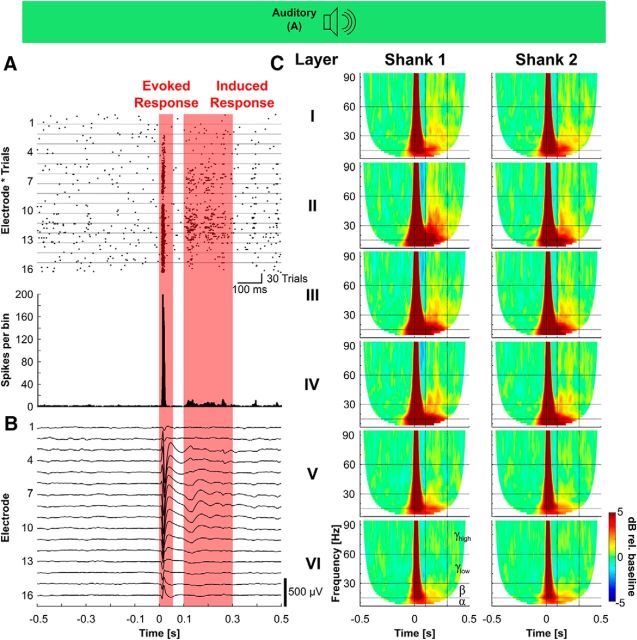
Figure 2.
Response of A1 to transient acoustic stimulation. A, Example of multiunit activity elicited by acoustic click stimuli. In the raster plot of the first 16 channels (top), as well as the collapsed peristimulus time histogram (bottom) a strong primary excitation (evoked response) is visible, followed by a weaker secondary excitation (induced response). In the raster plot (top), each dot marks one action potential. The horizontal lines separate the data from different electrodes. For each electrode the response to each of 30 stimulus repetitions is shown stacked. B, Whereas the evoked response is visible in the trial-averaged LFP response, the induced response is more difficult to distinguish from background activity. C, Grand mean time-frequency representation (baseline-corrected, total power) showed the strong early response component, as well as a longer-latency response in the 100–300 ms time window (vertical dashed lines). Horizontal dashed lines show borders of the frequency band definition used herein (α < 15 Hz, 16 < β < 30 Hz, 31< γlow < 60 Hz, γhigh > 60 Hz).

