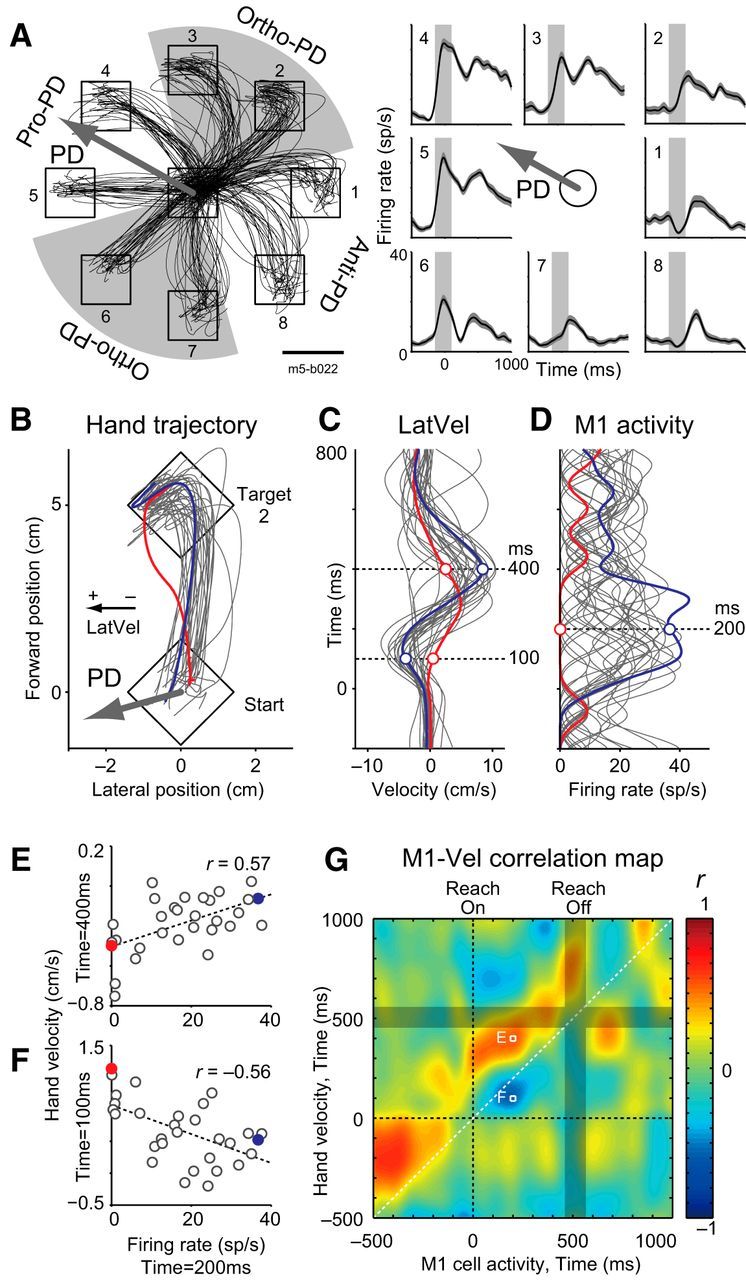
Figure 4.

Example of intertrial correlation between M1 neuron activity and hand velocity. A, Classification of reach directions according to an example neuron's PD (m5–b022). Left, Hand trajectories for eight different target locations by Monkey E (30 trials). Right, Activity of M1 neuron for each target location averaged across trials. Traces were aligned to reach onset. Solid line and shaded area indicates mean and SEM, respectively. Vertical gray rectangle indicates the time window for calculation of the neuron's PD. The arrow defines the PD of this neuron (PD = 151°). According to the neuron's PD, targets were separated into four equally spaced areas and then categorized into three groups: targets in the PD (pro-PD), opposite to the PD (anti-PD), and orthogonal to the PD (ortho-PD). Traces denote the hand trajectories for each target. Scale bar, 3 cm. B, Hand trajectory for an ortho-PD target (target 2, movement direction is rotated to vertical for presentation purposes). The arrow indicates the neuron's PD relative to the target direction. Two exemplar trials are highlighted and color-coded throughout this figure (red and blue). C, LatVel corresponding to B. Traces are aligned to reach onset. Horizontal dashed lines indicate the time points displayed in E and F. D, The neuron's activity for each trial. Same format as C but the horizontal axis represents neuron's firing rate (spikes per second, sp/s). E, Intertrial correlation between M1 activity at 200 ms and LatVel at 400 ms after reach onset. Dashed line denotes linear regression (Pearson correlation coefficient, r). F, Same format as E except between M1 activity at 200 ms versus LatVel at 100 ms after reach onset. G, Intertrial correlation map between activity of this neuron and LatVel (M1-Vel correlation map). The basic format is same as Figure 2F, but the horizontal axis represents the timing of M1 activity.
