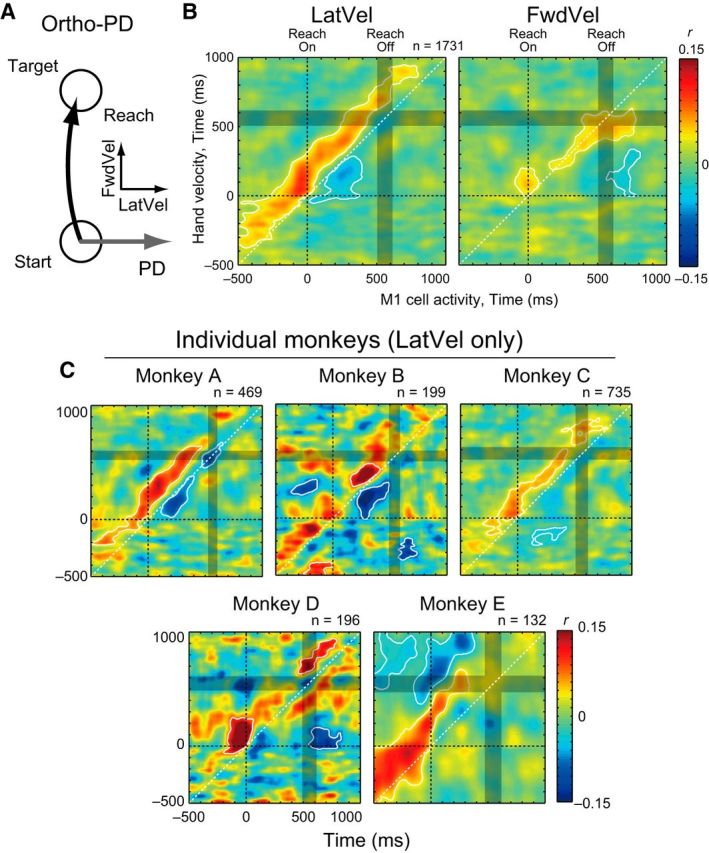
Figure 5.

M1-Vel correlation during ortho-PD reaching. A, Schema about the PD and hand velocities. B, M1-Vel correlation map between M1 activity for ortho-PD target direction with LatVel (left) and FwdVel (right). Maps were averaged across datasets (1731 neuron–target pairs). The basic format is same as Figure 3A, but the horizontal axis represents the timing of M1 activity. White contours indicate the area where r was significantly different from the shuffled data (p < 0.05 with cluster size correction, paired t test). C, M1-Vel correlation maps for individual animals. Same format as B.
