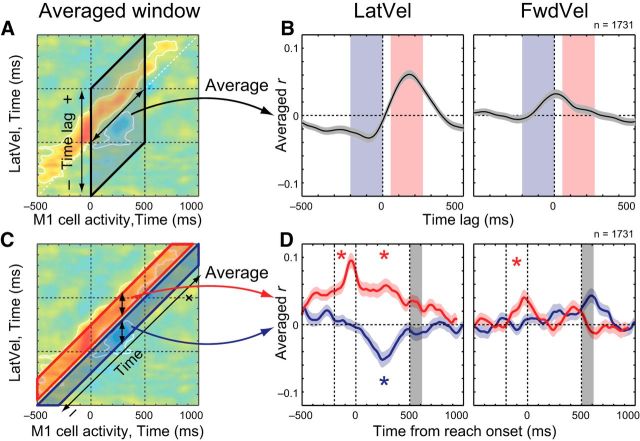
Figure 6.
Temporal profiles of M1-Vel correlation map. A, Schema for the averaging method. Correlation coefficients were averaged in a direction parallel to the matrix diagonal (double-headed arrow) from 0 to 500 ms after reach onset. B, Intertrial correlation between M1 activity and hand velocity (left: LatVel, right: FwdVel) was averaged within reaching time (from 0 to 500 ms after reach onset). The horizontal axis indicates the time lag between M1 activity and hand velocity, where positive and negative values indicate that an increase in M1 activity precedes and lags an increase in hand velocity, respectively. Red and blue shades indicate selected time windows used in C and D. C, Schema showing the averaging method. Correlation coefficients were averaged along vertical strips (double-headed arrows) from 50 to 250 ms (future, red area) and −200 to 0 ms (past, blue area). D, Intertrial correlation between M1 activity and hand velocity (left: LatVel, right: FwdVel) averaged within 200 ms time window before (from −200 to 0 ms, blue) or after (from 50 to 250 ms, red) the M1 activity. Data are aligned to reach onset and gray shade denotes 50% interval of the distribution of reach offset. Asterisk indicates a significant difference from the shuffled data (p < 0.05 with Bonferroni correction, paired t test) before (from −200 to 0 ms relative to reach onset, dashed lines) or during t(from 0 to 500 ms, dashed lines) he movement epoch. Shaded area, SEM.

