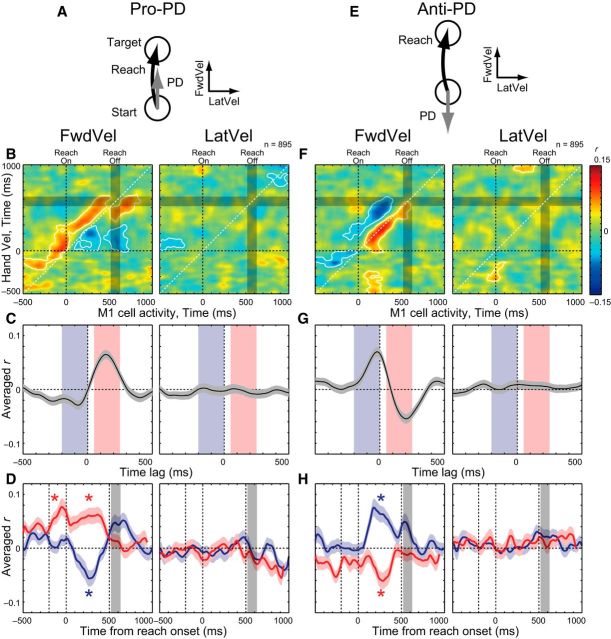
Figure 7.
M1-Vel correlations during pro- and anti-PD reaching. A, Schema about the PD and hand velocities. B, M1-Vel correlation maps for pro-PD reaching: FwdVel (left) and LatVel (right). Same format as Figure 5B. C, D, Averaged intertrial correlation. Same format as Figure 6, B and D. E–H, M1-Vel correlation maps for anti-PD reaching. Same format as A–D.

