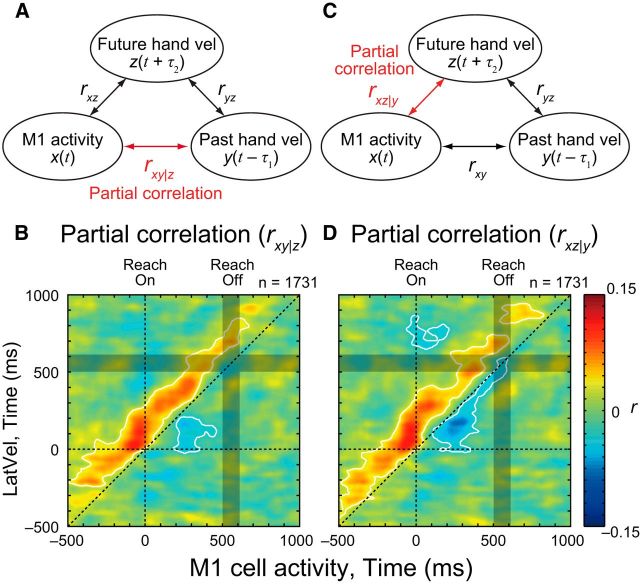
Figure 8.
Partial correlation between M1 activity and hand velocity. A, Schema showing partial correlation analysis. B, Partial correlation map (rxy|z) between M1 activity and LatVel with controlling the effect of future hand velocity in ortho-PD group. Same format as Figure 5B. White contours indicate the area where rxy|z was significantly different from the chance level (p < 0.05 with cluster size correction, paired t test). C, D, Partial correlation map (rxz|y) between M1 activity and LatVel with controlling the effect of past hand velocity. Same format as A and B.

