
Figure 8.
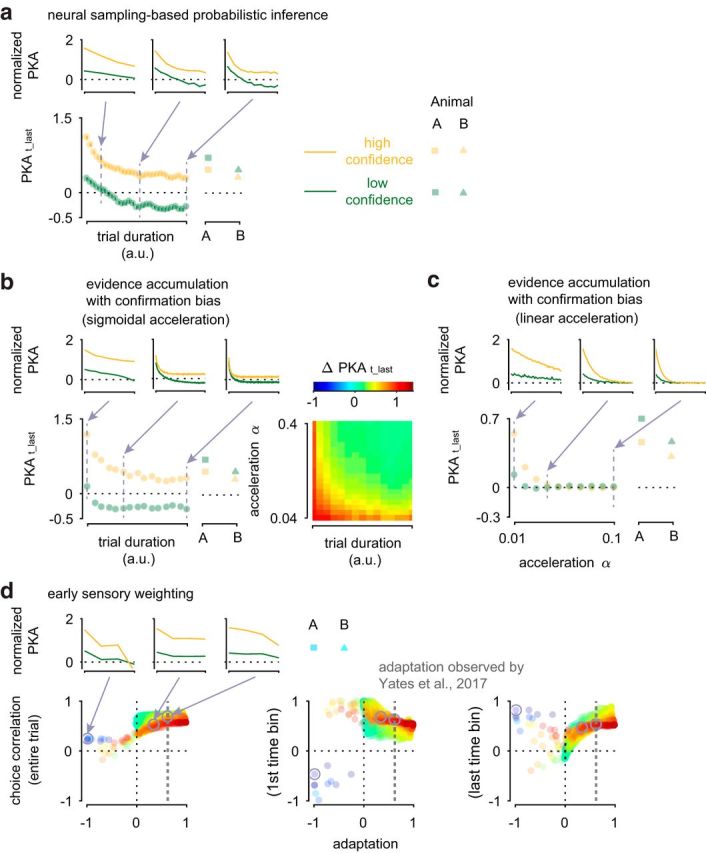
Exploring the parameter space of the models. Quantifying the PKA in the last time bin (PKAt_last) for high- and low-confidence trials. Insets, PKAs separated by confidence (colors as in Figs. 1, 7) predicted by each model. Values for Animal A and B are included for comparison. a, Exploring parameters of the neural sampling-based probabilistic inference model (Haefner et al., 2016). Model parameters were chosen such that the average PKA decreased. We then explored PKAt_last when systematically increasing the trial duration. While systematically decreasing with trial duration, for high-confidence trials, PKAt_last,high_confidence > PKAt_last,low_confidence across all parameters. b, Simplified model of evidence accumulation with confirmation bias (sigmoidal acceleration; see Materials and Methods), mimicking the behavior of a or of a choice attractor (Wimmer et al., 2015) and a bimodal distribution of the decision variable late in the trial (double-well energy landscape). Similar to a, PKAt_last,high_confidence > PKAt_last,low_confidence. Moreover, ΔPKAt_last decreases with trial duration and with increasing the confirmation bias (parametrized by acceleration parameter α) but consistently remains positive, contrasting with the monkeys' data. c, Simplified model of evidence accumulation with confirmation bias (linear acceleration; see Materials and Methods) but a consistently unimodal distribution of the decision variable, in contrast to Wimmer et al. (2015) and Wong et al. (2007). When increasing α PKAt_last approaches 0 for both high- and low-confidence trials, in contradiction with the animals' data. d, Exploring parameters of the early sensory weighting model after Yates et al. (2017). We systematically changed the relative weights and the width of the stimulus and contrast kernel (parameters a, b, tmax, τ), thereby varying the degree and time course of the adaptation. The level of adaptation was evaluated in response to the preferred stimulus and quantified as the response at the end of the stimulus presentation relative to the peak response. Negative values for adaptation correspond to adaptation below baseline. Vertical dashed line indicates the degree of adaptation observed by Yates et al. (2017) for MT neurons. Only simulations for which a decrease in the overall kernel amplitude over time is observed, and for which the PKA in high-confidence trials exceeds that for low-confidence trials in the first time bin were included. We plot ΔPKAt_last (color code as defined in b, right) as a function of the degree of adaptation (abscissa) and the neuron's correlation with the choice of the model (choice correlation, quantified as defined by Pitkow et al., 2015). Choice correlation was evaluated for the entire trial (left) and the first (middle) and last (right) time bin. We found that ΔPKAt_last < 0 (blue data points) only for sensory responses that were otherwise inconsistent with empirical data (i.e., suppression of the sensory response below baseline or negative correlation with choice early during the trial; compare middle panel).