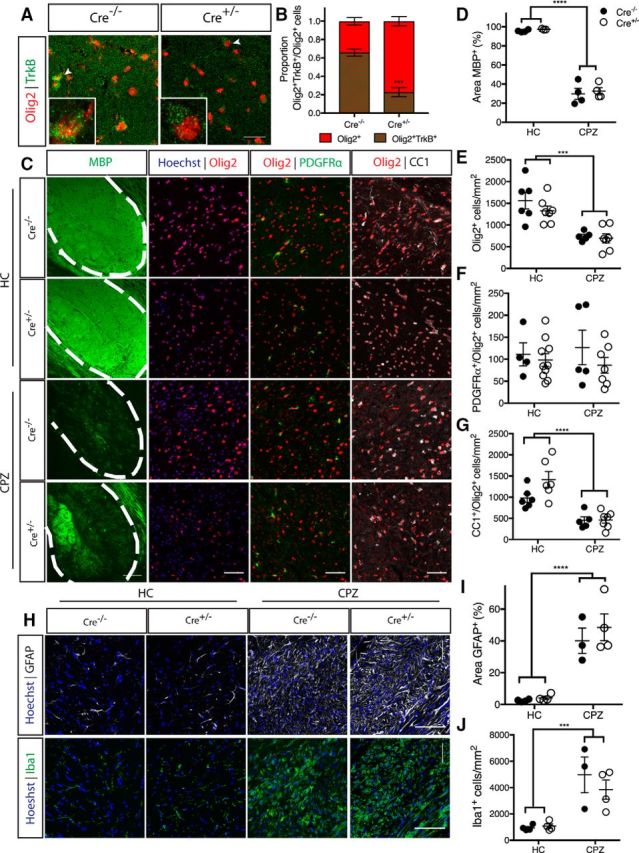
Figure 4.

CNPaseCre+/− × TrkBfl/fl mice exhibit normal adult myelination and response to cuprizone-demyelination. A, Representative micrographs of TrkB and Olig2 immunostaining in the caudal corpus callosum of CNPaseCre−/− and CNPaseCre+/− TrkBfl/fl healthy controls aged 16 weeks. Scale bar, 20 μm. B, Proportion of Olig2+ cells positive for TrkB was significantly decreased in CNPaseCre+/− TrkBfl/fl mice compared with Cre−/− controls. Student's t test, n = 4–6/group. ***p = 0.0003. Mean ± SEM plotted. C, Representative micrographs of immunostaining for MBP and oligodendrocyte lineage markers Olig2, PDGFRα, and CC1 in the caudal corpus callosum of CNPaseCre−/− (closed circles) and CNPaseCre+/− (open circles) TrkBfl/fl healthy controls (HC), and cuprizone-fed (CPZ) mice. Scale bar, 50 μm. D, Area of MBP immunostaining and (E) Olig2+ cell density were unchanged due to genotype in the healthy controls, but were significantly decreased in both genotypes following cuprizone treatment (****p < 0.0001 and ***p < 0.001, respectively). F, Density of Olig2+PDGFRα+ OPCs was unchanged with cuprizone treatment or genotype (p = 0.94). G, Olig2+CC1+ oligodendrocytes were unchanged between genotypes in healthy controls, while cuprizone feeding significantly reduced the density of these cells in the caudal corpus callosum of both genotypes (****p < 0.0001). H, Representative micrographs of GFAP+ astrocytosis and Iba1+ microglia in the caudal corpus callosum of Cre−/− and Cre+/− HC and CPZ mice. Scale bar, 50 μm. I, Percentage area GFAP+ and (J) density of Iba1+ microglia were similar in both genotypes in HCs, and were increased in both genotypes following CPZ (****p < 0.0001, ***p = 0.0003). D–G, I, J, n = 3–7/group, two-way ANOVA.
