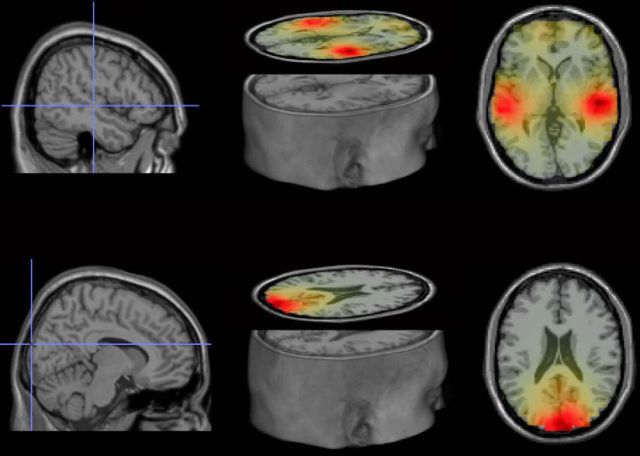
Figure 4.
Source localization of theta power in the unimodal conditions. Top, Auditory sources, MNI coordinates of ROIs: right, 50, −21, 0; left, −60, −29, 0. Bottom, Visual source, MNI coordinates of ROI: 10, −99, 20. Evoked power was averaged over 3.5 and 4.5 Hz, between 0.75 and 2.75 s at each virtual electrode in the unimodal movie and sound conditions and the baseline conditions (see Materials and Methods). Grand average power differences between unimodal conditions and baseline conditions were interpolated to a MNI MRI template. The source coordinates were determined by where the maximum grand average power differences were. The source plots were generated by the Fieldtrip toolbox and MRIcro for OSX (http://www.mccauslandcenter.sc.edu/crnl/mricro).

