Figure 2.
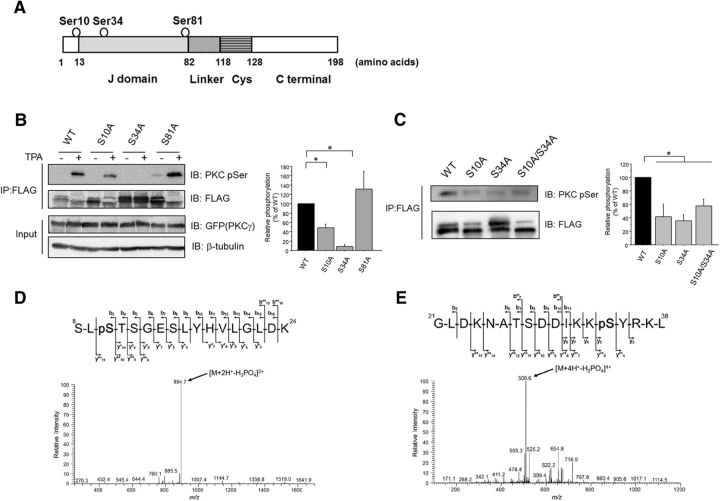
cPKC mediates the phosphorylation of CSPα at Ser10 and Ser34 in cultured cells. A, Schematic illustrations of the CSPα. The predicted phosphorylation sites are circled. Cys, Cysteine string domain. B, COS7 cells transfected with FLAG-tagged CSPα (WT and Ser/Ala mutants) and GFP-tagged PKCγ were stimulated with 1 μm TPA for 30 min. FLAG-tagged CSPα was precipitated and separated by SDS-PAGE. The phosphorylation levels of the FLAG-tagged CSPα proteins determined with an anti-pSer PKC Ab were normalized to the protein levels of the CSPα (WT and Ser/Ala mutants) determined by immunoblots with an anti-FLAG Ab. The right bar graph shows the relative phosphorylation levels normalized to the WT CSPα levels, which were set as 100% (n = 6, *p < 0.05 vs WT, 1-way ANOVA with post hoc Games–Howell test). C, PC12 cells transfected with FLAG-tagged CSPα (WT and Ser/Ala mutants) were incubated for 72 h. The phosphorylation levels of the FLAG-tagged CSPα proteins determined with an anti-pSer PKC Ab were normalized to the protein levels of the CSPα (WT and Ser/Ala mutants), determined by immunoblots with an anti-FLAG Ab. The right graph shows the relative phosphorylation levels normalized to the WT CSPα levels, which were set as 100% (n = 6, *p < 0.05 vs WT, 1-way ANOVA with post hoc Dunnett's test). D, HPLC/MS/MS spectrum of phosphopeptide representing 8–24 residues of CSPα after PKCγ assay. Product ion spectrum of the doubly charged peptide at m/z ratio 943.4528 was acquired on a linear ion trap mass spectrometer. The predominant product ion at m/z ratio 894.7 generated by neutral loss of 98.0 Da (H3PO4) is clearly visible, featuring a product ion spectrum of a phosphoserine/phosphothreonine-containing peptide. Sequence-revealing product ions appeared at relatively weak intensity; however, they were sufficient to distinguish the exact site (S10) of phosphorylation among five potential sites (S8, S10, T11, S12, and S15). E, HPLC/MS/MS spectrum of phosphopeptide representing 21–38 residues of CSPα after PKC assay. Product ion spectrum of the quadruply charged peptide m/z ratio 533.7739 was acquired on a linear ion trap mass spectrometer. The predominant product ion at m/z ratio 509.6 generated by neutral loss of 98.0 Da (H3PO4) is clearly visible, featuring a product ion spectrum of a phosphoserine/phosphothreonine-containing peptide. Sequence-revealing product ions appeared at relatively weak intensity; however, they were sufficient to distinguish the exact site (S34) of phosphorylation among three potential sites (T27, S28, and S34).

