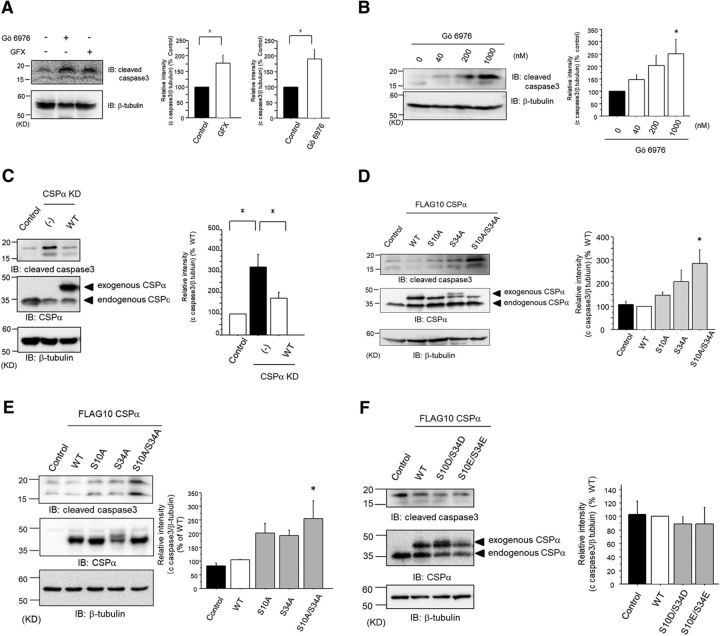
Figure 3.
Phosphorylation of CSPα, at Ser10 and Ser34, promotes cell survival. A, Immunoblot for anti-cleaved caspase-3 Ab after treatment with 1 μm GFX, or Gö6976, for 72 h was examined in PC12 cells. The right bar graphs represent the cleaved caspase-3 levels with PKC inhibitors, normalized to the control levels, which were set to 100%. The results are expressed as mean ± SEM (n = 4; *p < 0.05, unpaired t test). B, Immunoblot for anti-cleaved caspase-3 was examined with 0, 40, 200, and 1000 nm Gö6976 for 72 h. The cleaved caspase-3 levels with Gö6976 were normalized to the levels without Gö6976, which were set to 100%, as shown in the right graph (n = 4; *p < 0.05 vs control, 1-way ANOVA with post hoc Dunnett's test). The results are expressed as mean ± SEM. C, Immunoblot for anti-cleaved caspase-3 was examined in PC12 cells transfected with control, shRNA for CSPα, and both shRNA for CSPα and CSPα WT with shRNA-resistant sequences. The bar graph represents the quantification of the cleaved caspase-3 levels with shRNA and with shRNA and CSPα WT, normalized to the levels of control, which were set to 100%. The results are expressed as mean ± SEM (n = 9, *p < 0.05 1-way ANOVA with post hoc Tukey's test). D, Immunoblot for anti-cleaved caspase-3 was evaluated in PC12 cells transfected with FLAG-tagged CSPα (WT and Ser/Ala mutants). The levels of endogenous CSPα and exogenous CSPα were confirmed. Comparable levels of all ectopically expressed CSPα proteins were confirmed by Western blot analyses. The cleaved caspase-3 levels of CSPα mutants were normalized to the levels of WT, which were set to 100%, as shown in the right bar graph. The results are expressed as mean ± SEM (n = 6, *p < 0.05 vs WT, 1-way ANOVA with post hoc Dunnett's test). E, Immunoblot for anti-cleaved caspase-3, evaluated in SHSY5Y cells transfected with FLAG-tagged CSPα (WT and Ser/Ala mutants). The levels of endogenous CSPα and exogenous CSPα were confirmed. Comparable levels of all ectopically expressed CSPα proteins were confirmed by Western blot analyses. The cleaved caspase-3 levels of the CSPα mutants were normalized to the levels of WT, which were set to 100%, as shown in the bar graph. The results are expressed as mean ± SEM (n = 4, *p < 0.05 vs WT, 1-way ANOVA with post hoc Dunnett's test). F, Immunoblot for anti-cleaved caspase-3 was evaluated in PC12 cells transfected with FLAG-tagged CSPα (WT, Ser/Glu, and Ser/Asp mutants). The levels of endogenous CSPα and exogenous CSPα were confirmed. Comparable levels of all ectopically expressed CSPα proteins were confirmed by Western blot analyses. The cleaved caspase-3 levels of the CSPα mutants were normalized to the levels of WT, which were set to 100%, as shown in the bar graph. The results are expressed as mean ± SEM (n = 3).

