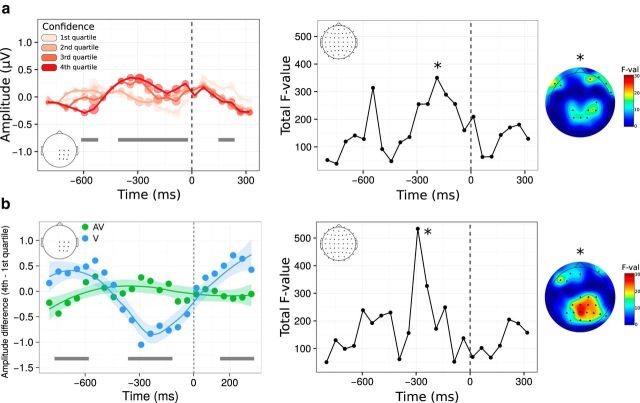
Figure 6.
Voltage amplitude time locked to correct type 1 responses as a function of confidence. a, Left, Time course of the main effect of confidence within a predefined ROI. Although raw confidence ratings were used for the statistical analysis, they are depicted here as binned into four quartiles, from quartile 1 corresponding to trials with the 25% lowest confidence ratings (light pink) to quartile 4 corresponding to trials with the 25% highest confidence ratings (dark red). The size of each circle along the amplitude line is proportional to the corresponding F-value from mixed model analyses within 50 ms windows. Right, Same analysis as shown in a on the left on the whole scalp. The plot represents the time course of the summed F-value over 64 electrodes for the main effect of confidence. The topography where a maximum F-value is reached (*) is shown next to each plot. b. Left, Time course of the interaction between confidence and condition following a linear mixed-model analysis within the same ROI as in a. Although raw confidence ratings were used for the statistical analysis, the plot represents the difference in voltage amplitude between trials in the fourth versus first confidence quartile. Right, Same analysis as shown in b on the left on the whole scalp, with corresponding topography. In all plots, gray bars correspond to significant main effects (a) or interactions (b), with p < 0.05 FDR corrected. Significant effects on topographies are highlighted with black stars (p < 0.001, uncorrected).

