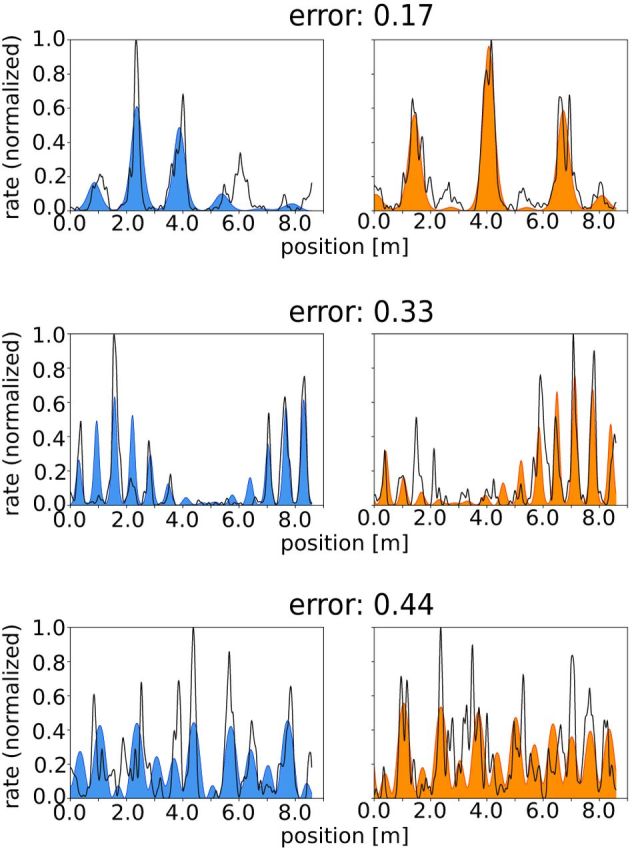
Figure 2.

Three examples of best fits of the firing rate along a linear track: left/right panels show the measured firing rates along the track (black lines) and the firing rates predicted from cuts through two-dimensional hexagonal patterns (blue/orange) for left-to-right/right-to-left runs.
