
Figure 4.
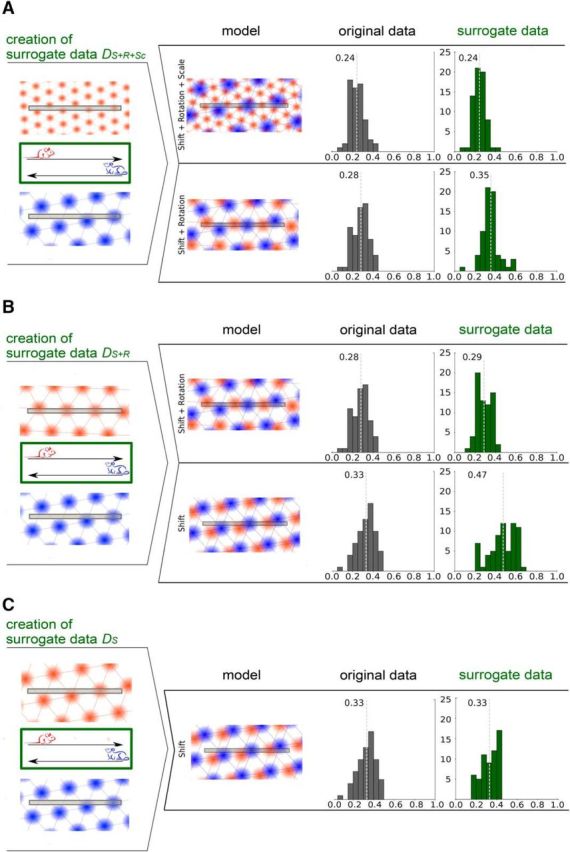
Error distribution for surrogate data for the scenarios Shift+Rotation and Shift. Each light gray dotted line indicates the mean of the error distribution. A, Creation of surrogate data DS+R+Sc for the model Shift and Rotation by combining left-to-right and right-to-left runs from different animals and fitting these for the models Shift+Rotation+Scale and Shift+Rotation. B, Creation of surrogate data DS+R for the model Shift were fitted for Shift+Rotation and Shift. Error distributions of the original (gray) and surrogate (green) data. C, Creation of surrogate data DS by combining left-to-right and right-to-left runs with similar grid spacings and rotations from different animals and fitting these for the models Shift.