Figure 2.
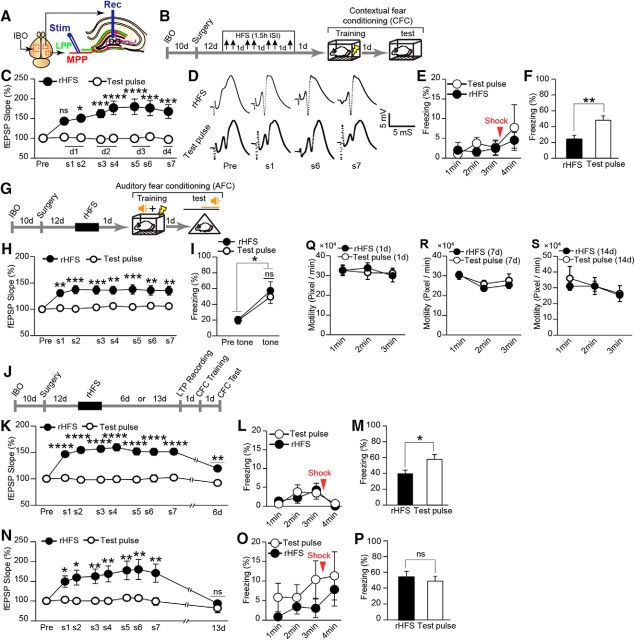
Recovery from hippocampal LTP saturation correlates with the memory capacity for CFC. A, Schematic illustration showing experimental setup for IBO injection and electrode implantation (for detailed information regarding the coordinates of the IBO injection, see Table 1). MPP, Medial perforant path; LPP, lateral perforant path; Rec, recording electrode; Stim, stimulating electrode. B, Experimental schedule for the effect of rHFS. Top arrows indicate the stimulation session. C, Saturation of hippocampal LTP. The normalized values for the fEPSP slope for rHFS (n = 9) and test pulse (n = 7) rats [(two-way ANOVA, p = 0.0009, F1,14 = 17.58, rHFS vs test pulse (s1, p = 0.1; s2, p = 0.01; s3, p = 0.0008; s4, p < 0.0001; s5, p < 0.0001; s6, p = 0.0001; s7, p = 0.0002), Bonferroni corrected for multiple comparisons)]. s, Session. D, Example traces of evoked fEPSP responses. Pre, Before rHFS. E, Freezing time during the training session (rHFS, n = 9; test pulse, n = 7 rats; two-way ANOVA, p = 0.5589, F1,14 = 0.3584). F, Average freezing response during the test session (rHFS, n = 9; test pulse, n = 7 rats; unpaired t test, p = 0.0051, t14 = 3.31). G, Experimental schedule for AFC. H, Normalized values for the fEPSP slope in rHFS and test pulse rats (n = 9 rats/group; two-way ANOVA, p = 0.001, F1,16 = 16.11, Bonferroni corrected for multiple comparisons). I, Freezing response before tone (pre) and during tone period (tone; n = 9 rats/group) in the AFC test (paired t test, rHFS pre-tone vs tone, p = 0.01, t8 = 3.18; test pulse pre-tone vs tone, p = 0.01, t8 = 3.19; unpaired t test, rHFS tone vs test pulse tone, p = 0.58, t16 = 0.56). J, Experimental schedule to check the gradual decay of synaptic efficacy and recovery of learning capacity. K, LTP partially decayed after 6 d (two-way ANOVA, p < 0.0001, F1,15 = 63.82; rHFS d6 vs test pulse d6, p = 0.0012; Bonferroni corrected for multiple comparisons). L, Freezing time during the training session (two-way ANOVA, p = 0.8422, F1,15 = 0.0410; test pulse, n = 9; rHFS, n = 8 rats). M, Incomplete recovery of learning capacity (unpaired t test, p = 0.03, t15 = 2.29) 7 d after the last HFS (test pulse, n = 9; rHFS, n = 8 rats). N, LTP returned to the baseline level 13 d after rHFS (two-way ANOVA, p = 0.0065, F1,14 = 10.18; rHFS d13 vs test pulse d13, p > 0.99; Bonferroni corrected for multiple comparisons). O, Freezing time during the training session (two-way ANOVA, p = 0.2778, F1,14 = 1.275; n = 8 rats/group). P, Recovery of learning capacity (unpaired t test, p = 0.60, t14 = 0.53, n = 8 rats/group). Q–S, Motility of the rHFS- and test pulse-treated rats on day 1 (Q, two-way ANOVA, p = 0.91, F1,14 = 0.01; rHFS, n = 9; test pulse, n = 7 rats), day 7 (R, two-way ANOVA, F1,15 = 0.37, p = 0.55; rHFS, n = 8; test pulse, n = 9 rats), and day 14 (S, two-way ANOVA, p = 0.74, F1,14 = 0.11; n = 8 rats/group) after the last HFS. *p < 0.05, **p < 0.01, ***p < 0.001, ****p < 0.0001; ns, not significant.

