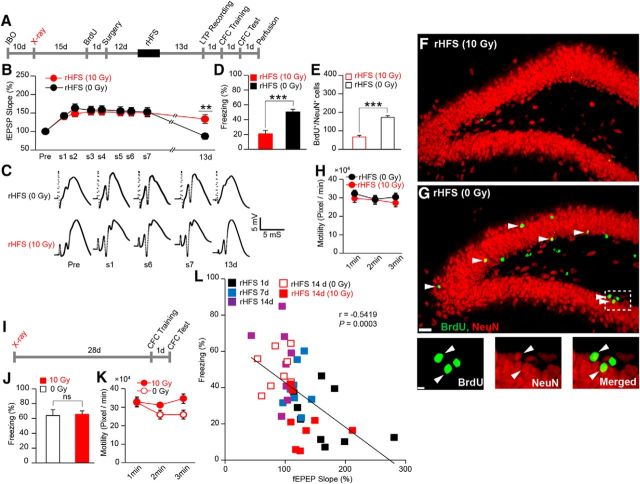
Figure 3.
Adult hippocampal neurogenesis regulates the recovery from rHFS-induced impairment of CFC. A, Experimental schedule. B, LTP maintenance in nonirradiated (0 Gy) and x-ray-irradiated (10 Gy) rats [two-way ANOVA, p = 0.91, F1,14 = 0.01; rHFS (10 Gy) 13 d vs rHFS (0 Gy) 13 d, unpaired t test, p = 0.006, t14 = 3.23, n = 8 rats/group]. C, Example traces of evoked fEPSP responses. Pre, Before rHFS. D, Freezing response during the test session (unpaired t test, p = 0.0002, t14 = 4.87, n = 8 rats/group). E, Reduced neurogenesis in the rHFS-irradiated rats (n = 3 rats/group, unpaired t test, p = 0.0009, t4 = 8.77). F, G, Hippocampal coronal sections. Scale bar, 200 μm. Arrowheads indicate BrdU+/NeuN+ double-positive cells. G, Bottom, magnified images from rHFS (0 Gy): BrdU (left), NeuN (middle), and merged (right). Scale bar, 50 μm. H, Effect of rHFS and x-ray irradiation on the motility of the animals 14 d after the last HFS (two-way ANOVA, p = 0.37, F1,15 = 0.83; n = 8 rats/group). I, Experimental schedule for the effect of x-ray on CFC. J, Freezing response at test (10 Gy, n = 8; 0 Gy, n = 7 rats; unpaired t test, p = 0.84, t13 = 0.19). K, Effect of x-ray irradiation on the general activity of the animals 28 d after x-ray irradiation (two-way ANOVA, p = 0.07, F1,13 = 3.64; 10 Gy, n = 8; 0 Gy, n = 7 rats). L, Correlation of LTP and learning ability (Pearson correlation test, r = −0.5419, p = 0.0003). Each dot represents data from an individual animal. *p < 0.05, **p < 0.01, ***p < 0.001; ns, not significant.

