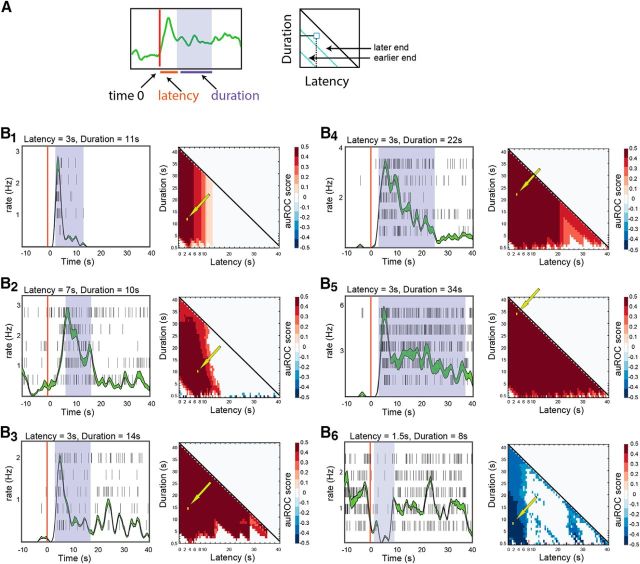
Figure 2.
Analysis of stimulus detection for individual neuron–stimulus combinations. A, Schematic illustrating the definition of latency and duration of temporal windows for analysis. The scheme also shows how latency and duration are mapped on the auROC matrix. Each pixel in the matrix shows the auROC score associated with a particular latency and duration of the response of the neuron to one stimulus, compared with baseline. For example, the bottom row of each matrix represents 0.5 s windows at various latencies from stimulus onset, while the leftmost column represents windows starting at time 0, increasing in duration in 0.5 s steps. B1–B6, Examples of auROC analysis for individual neurons. Each panel shows a raster plot and a peristimulus rate histogram (lines represent SE boundaries) on the left and the auROC matrix on the right. The shaded regions shown over each of the raster displays indicate one (arbitrarily selected) window providing optimal discrimination. These windows are also indicated by the arrows over the corresponding matrices. Time 0 (vertical red lines) corresponds to the onset of stimulus delivery. The following stimuli were presented in each of the examples: B1, C57BL/6 castrated male urine mix (diluted 1:10); B2, C57BL/6 estrus female urine mix (diluted 1:33); B3, castrated BALB/C male urine mix (diluted 1:10); B4, castrated C57BL/6 male urine mix (diluted 1:10); B5, C57BL/6 castrated male urine mix (diluted 1:10); B6, mix of C57BL/6 and BALB/C male urine (diluted 1:10).

