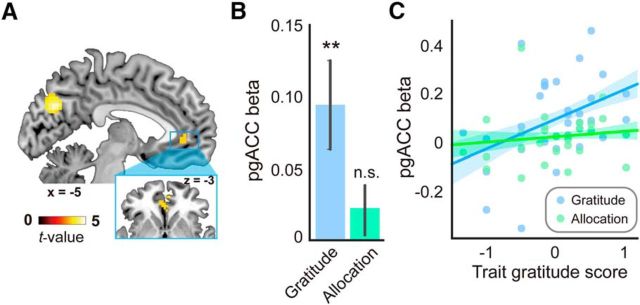
Figure 4.
Representation of gratitude. A, Whole-brain parametric contrast of constructed gratitude. B, pgACC responses to constructed gratitude (blue) and allocation (green). C, Relation between trait gratitude score and pgACC responses to constructed gratitude (blue) and allocation (green). **p < .005. Error bars indicate standard error of means.

