
Figure 6.
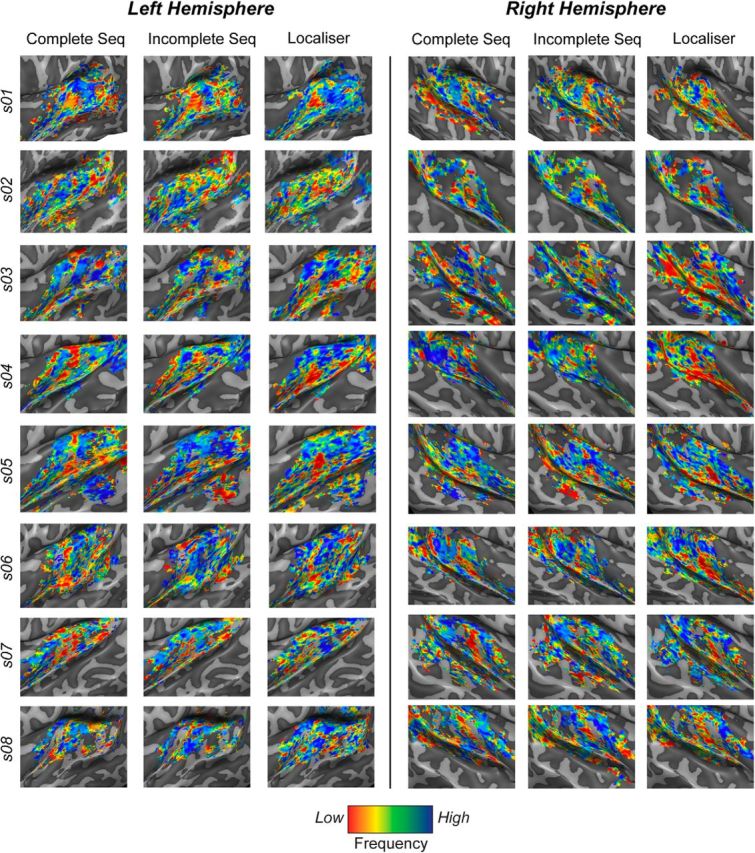
Tonotopic maps reconstructed from the activity to sequence presentation (Complete Seq, Omissions) and localizer frequencies (Localizer) for all subjects. Sequence preference maps were reconstructed by color coding the voxels independently of the complete and omission sequences that evoked the highest responses. Color codes were assigned depending on the frequency of the target in the sequence. The best-frequency maps were obtained by color coding each voxel depending on which of the four localizer frequencies elicited the highest voxel activation. Obtained surface maps are highly similar and reflect the characteristic tonotopic gradients in the AC.