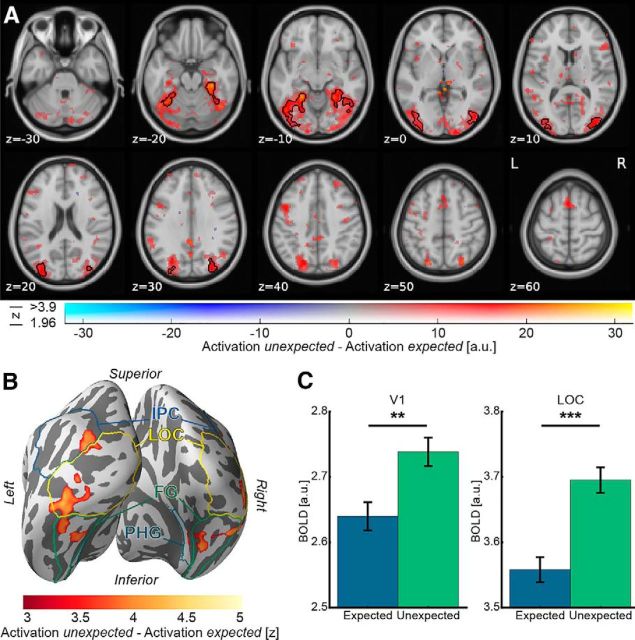
Figure 2.
A, Expectation suppression throughout the ventral visual stream. Displayed are parameter estimates for unexpected image pairs minus expected pairs overlaid on the MNI152 2 mm template. Color represents the parameter estimates: red-yellow clusters represent expectation suppression; opacity represents the associated z statistics. Black contours outline statistically significant clusters (Gaussian random field cluster corrected), which include significant expectation suppression in superior and inferior divisions of LOC, temporal occipital fusiform cortex, and posterior parahippocampal gyrus. B, Expectation suppression displayed on an inflated cortex reconstruction. z statistics of the expectation suppression contrast (cluster thresholded) are displayed. Visible are large clusters showing significant expectation suppression in LOC, fusiform gyrus (FG), inferior parietal cortex (IPC), and posterior parahippocampal gyrus (PHG). C, Expectation suppression within V1 and object-selective LOC. Displayed are parameter estimates ± within-subject SE for responses to expected and unexpected images pairs. In both ROIs, V1 (left bar plot) and LOC (right bar plot), BOLD responses to unexpected image pairs were significantly stronger than to expected image pairs. **p < 0.01. ***p < 0.001.

