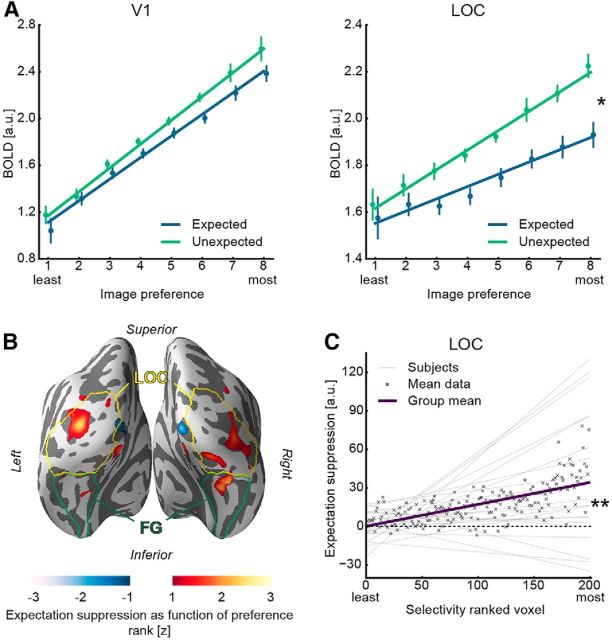
Figure 3.
A, Image preference analysis results in V1 and object-selective LOC. Parameter estimates ± within-subject SE are displayed as a function of voxelwise image preference, ranked from the least to the most preferred image rank based on the functional localizer. Superimposed is the mean regression line fit of the subjectwise regressions for expected and unexpected image pairs separately (see Materials and Methods). Left line plot represents responses to expected and unexpected image pairs within the V1 ROI. The fitted regression lines for expected and unexpected are parallel (i.e., no difference in slopes). Right plot represents image preference results for object-selective LOC, showing a steeper slope for the unexpected image pair regression line compared with the corresponding expected image pair regression line. B, Image preference analysis results displayed on an inflated cortex reconstruction. z statistic (uncorrected) of expectation suppression as function of image preference rank is shown: red represents more suppression for preferred stimuli (dampening); blue represents less suppression for preferred stimuli (sharpening). Visible are clusters showing a dampening effect largely in bilateral LOC and, to a lesser extent, in fusiform gyrus (FG). C, Expectation suppression (unexpected − expected) as function of voxel selectivity, ranked from the least to the most selective voxels, in object-selective LOC. Displayed are the linear models per subject, the mean linear model (group mean), and the mean data for each selectivity ranked voxel. The amount of expectation suppression increases as a function of voxel selectivity. *p < 0.05. **p < 0.01.

